
Traders commonly use the triple top pattern as a technical chart pattern in financial markets like stocks, currencies, or commodities, It’s a sign of the beginning of the bearish market.
What is Triple Top pattern?
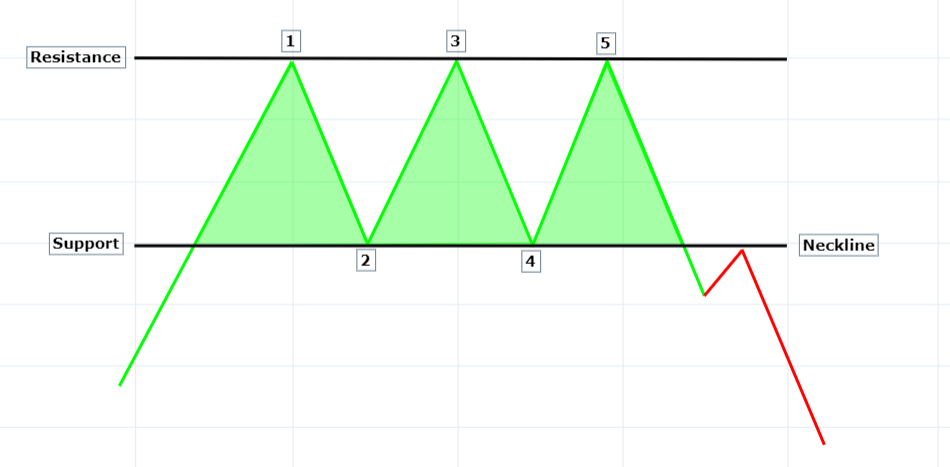
The price of an asset reaches a peak two times before and fails to break above that level for the third time, potentially leading to a trend reversal. This pattern features three peaks of almost equal height with two short troughs in between. The resistance level is established by the trend line that connects the highs. If the price fails to break above it, this indicates a weakening buying momentum and potential takeover by sellers, resulting in a downward trend. It’s important to note that technical analysis is not a foolproof method and other factors can impact the price movement of an asset.
How to use Triple Top Pattern?
Traders and investors can use the triple top pattern in technical analysis of financial markets, such as stocks, currencies, or commodities, by following these steps:
- Identify the pattern: Look for three consecutive peaks that are almost the same height, with two short troughs in between. Draw a trend line that connects the highs to confirm the pattern.
- Confirm the pattern: Use other technical indicators such as the relative strength index (RSI), moving averages, or volume indicators to confirm the pattern. Look for signals that indicate a weakening of buying momentum or an increase in selling pressure.
- Plan your trade: Once the pattern is confirmed, traders and investors can use the trend line as a resistance level to plan their trades. They may look for an opportunity to sell short, set a stop-loss order above the trend line, and target a profit below the recent low.
- Manage the risk: It’s important to manage risk by setting stop-loss orders to limit potential losses and adjusting them as the trade progresses. Traders may also consider the overall market conditions and other factors that may affect the price movement of the asset.
- Monitor the trade: Continuously monitor the trade and adjust the plan if necessary. If the price breaks above the trend line, it could indicate a failed pattern, and traders may need to reconsider their trade.
Traders and investors should use the triple top pattern in conjunction with other analysis methods and risk management strategies. It’s also important to remember that technical analysis is not always reliable, and other factors can affect the price movement of an asset.
Placing Stops and Taking Profits in Triple Top Pattern
When trading using the triple top pattern, it is essential to manage your risks effectively. To do this, you should consider placing stop-loss orders to limit potential losses and taking profits at appropriate levels. Here are some general guidelines on how to place stops and take profits in the triple top pattern:
When trading with the triple top pattern, effectively managing risks is crucial. To achieve this, you need to consider placing stop-loss orders to limit potential losses and taking profits at appropriate levels. Here are some general guidelines on how to place stops and take profits in the triple top pattern:
Take-profit order:
Traders can target a profit below the recent low, which acts as a support level in the pattern. The distance between the recent low and the trend line can be used to estimate the potential profit target. However, traders should also consider other market conditions and factors that may affect the price movement of the asset when setting profit targets.
Triple Top chart pattern on PBAINFRA in Daily charts
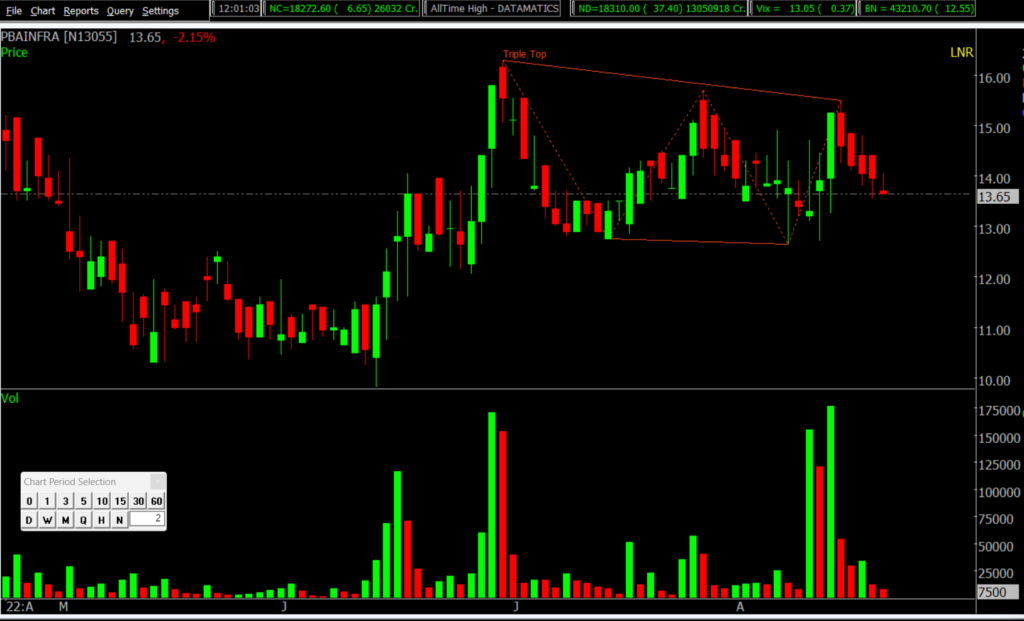
PBAINFRA is exhibiting a potential Triple Top chart pattern in its daily chart. Three Top have formed at a similar level, with a consolidation period in between. These top have created a strong Resistance level that has held up against three tests by the price. The pattern suggests that buying pressure may have been exhausted and sellers may be stepping in to resist the price.. However, traders should always confirm the pattern before entering a trade and implement proper risk management measures to mitigate potential losses.
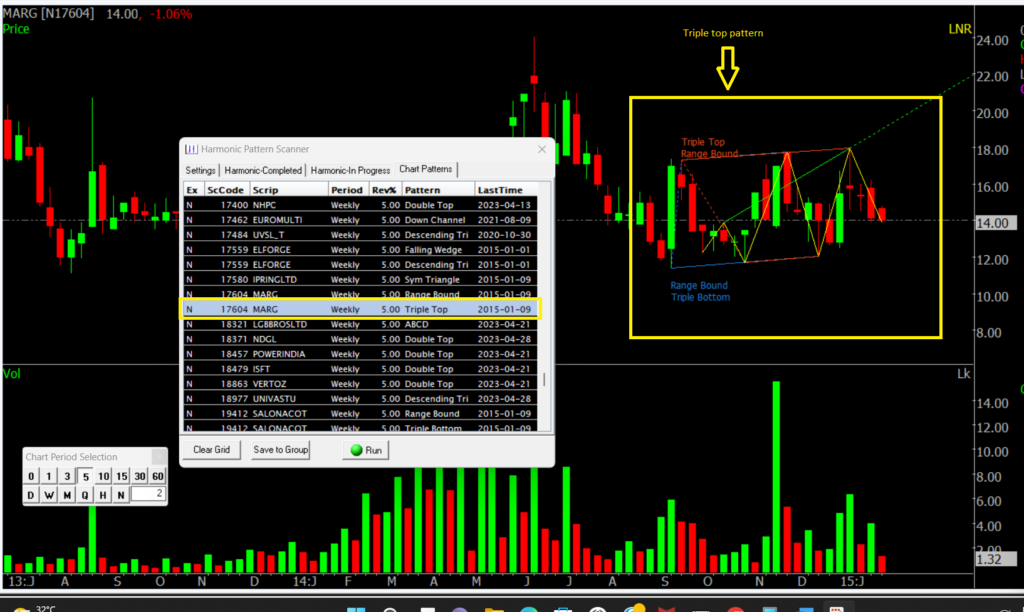
How to find the Stocks with Triple Top pattern Formation?
It is super easy to find any chart pattern using Spider Software, Triple Top can be found using the Chart Pattern Scanner of Spider, in just a couple of clicks..
Check out our Blog on Understanding Hedging Strategy to Manage Stock Market Risks
Don’t miss out on our Upcoming Master-Class on Learn & Trade Live on Expiry Day.
Register now and take your Trading game to the next level. *Click Here To Register*
Disclaimer: The information provided in this Blog is for educational purposes only and should not be construed as financial advice. Trading in the stock market involves a significant level of risk and can result in both profits and losses. Spider Software & Team does not guarantee any specific outcome or profit from the use of the information provided in this Blog. It is the sole responsibility of the viewer to evaluate their own financial situation and to make their own decisions regarding any investments or trading strategies based on their individual financial goals, risk tolerance, and investment objectives. Spider Software & Team shall not be liable for any loss or damage, including without limitation any indirect, special, incidental or consequential loss or damage, arising from or in connection with the use of this blog or any information contained herein.