The Head and Shoulders pattern is used in technical analysis. It is a specific formation in a chart that forecasts a bullish to bearish fashion reversal
What is Head and Shoulder pattern ?
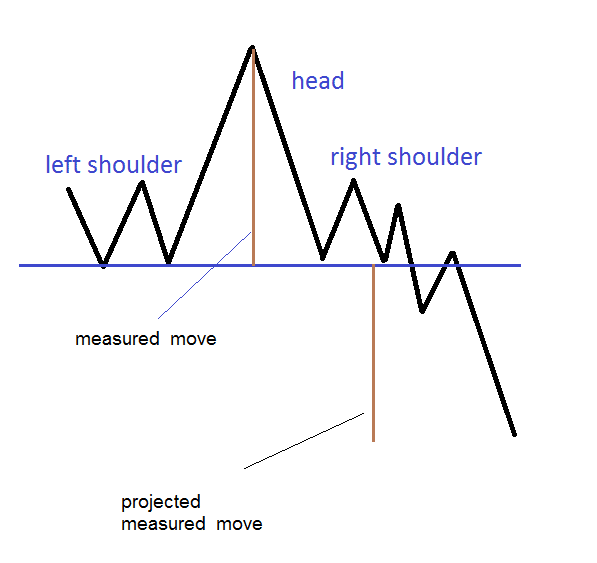
The pattern shows a baseline with three peaks, where the outer two are similar in height and the middle one is the tallest. A head and shoulders pattern occurs when a stock price reaches a peak and subsequently declines to the previous up move’s base. Subsequently, the price surpasses the prior high, forming a “head,” before retracing back to the initial base level.
The share price will eventually reach a peak near the initial top of the formation before declining once again. The Head and Shoulders pattern is considered one of the most reliable reversal patterns.
It is one of several top patterns indicating, to varying degrees of accuracy, the conclusion of an uptrend.
Things to keep in mind before trading in Head and Shoulder pattern:
Trading the head and shoulders pattern requires careful and patient observation. It’s important not to act immediately when the pattern begins to form, but rather let it fully develop. Watch the pattern without making trades until the chart reaches a breakout and crosses the neckline. Set profit targets for your trades by considering the pattern’s height and calculating the difference between the lowest trough. Once the pattern completes its course and reaches a breakout, take action accordingly. Exit the target or hold it as the price moves favorably, while always setting stop-loss orders. Exercising patience and allowing the pattern to fully develop is vital to effectively utilize it, given the potential for false signals.
How to trade in Head and Shoulder pattern:
It is important for traders to wait for the pattern to complete.
Traders should wait for the pattern to complete because it is possible that the pattern may not develop at all or that a partially developed pattern may not be completed in the future. Traders should watch partial or almost finished patterns, but they should refrain from making trades until the pattern breaks the neckline.In a head and shoulders pattern, we wait for the price to move below the neckline after the top of the right shoulder. For the inverse head and shoulders, we wait for the price to move above the neckline after the formation of the right shoulder.
The trade can be started after the pattern is completed. Plan your trade in advance, write down your entry, stops and profit targets and note any variables that will change your stop or profit target. The most common entry point is when there is a breakout – the neckline is broken and the trade is closed. Another entry point requires more patience and comes with the possibility that the move may be missed entirely. This method involves waiting for a pull to the neckline after the rip has already occurred. This is extra conservative in that we will see if the pullback stops and the original breakout direction resumes, the trade may be missed if the price continues to move towards the breakout.
Placing stops and taking profits in Head and Shoulder pattern
In the traditional market top pattern, the stops are placed just above the right shoulder (top pattern) after the neckline is pierced. Using the head of the pattern as a stop is an alternative, but it is considerably riskier and diminishes the pattern’s reward-to-risk ratio. In the reverse pattern, the stop is located just below the right shoulder. Placing the stop at the beginning of the pattern is an option, but it exposes the trader to higher risk.
Take-profit :
The profit target for the pattern is the price difference between the head and the bottom of both arms. To determine the downside price target, subtract this difference from the breakout level of the neckline.To establish the upside price target for a market bottom, add the difference to the breakout price of the neckline.
Head and Shoulder pattern chart pattern on Sapphire foods in 15 Min charts
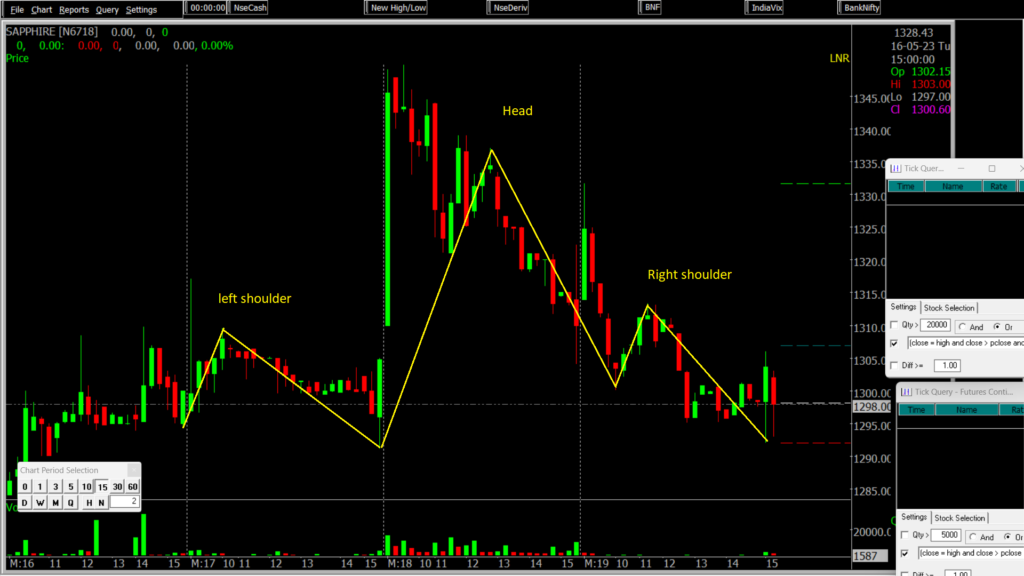
Sapphire foods is exhibiting a potential Head and Shoulder pattern chart pattern in its 15 Min charts. Prior to entering a trade, traders must confirm the pattern and employ effective risk management strategies to minimize potential losses.
Want to Learn How to do Trading in Live Market? With systematic Trading Strategy on the Day of Expiry. *Click Here To Know*

Disclaimer: The information provided in this Blog is for educational purposes only and should not be construed as financial advice. Trading in the stock market involves a significant level of risk and can result in both profits and losses. Spider Software & Team does not guarantee any specific outcome or profit from the use of the information provided in this Blog. It is the sole responsibility of the viewer to evaluate their own financial situation and to make their own decisions regarding any investments or trading strategies based on their individual financial goals, risk tolerance, and investment objectives. Spider Software & Team shall not be liable for any loss or damage, including without limitation any indirect, special, incidental or consequential loss or damage, arising from or in connection with the use of this blog or any information contained herein.