
Traders use harmonic pattern analysis as a valuable technique in the stock market to identify recurring price patterns. It assists traders in making informed investment decisions and predicting future market movements.
What are the common Harmonic Patterns in the Stock Market?
Harmonic patterns utilize Fibonacci sequences to create geometric pattern structures, involving retracement and projection swings/legs. Traders benefit from these specific (harmonic) patterns as they provide unique opportunities, including the identification of potential price movements and key turning or trend reversal points.
Traders gain a significant advantage through harmonic patterns, as they strive to offer reliable insights into price entries, stops, and targets. This aspect sets them apart from other indicators/oscillators, highlighting the unique functionality and effectiveness of harmonic patterns in trading strategies.
Traders employ harmonic patterns as chart patterns to identify pricing trends and predict future market movements. By incorporating these patterns into their trading strategies, they utilize Fibonacci numbers to construct geometric price patterns, allowing them to identify potential price shifts and trend reversals actively.
Most Common Types of Harmonic Patterns
The most common harmonic patterns include various types.
Butterfly Harmonic Pattern:
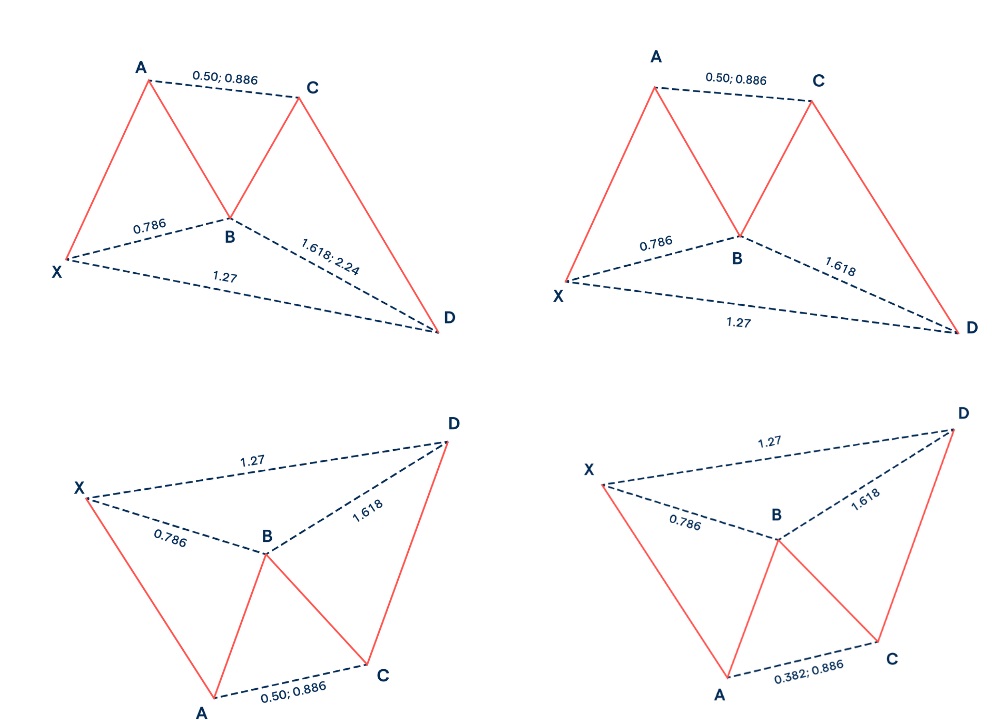
Bryce Gilmore developed the butterfly pattern by exploring Fibonacci ratios to identify potential market retracements.This particular pattern represents a reversal formation characterized by four legs denoted as X-A, A-B, B-C, and C-D. Among the Fibonacci ratios, the 0.786 retracement of the XA leg holds significant importance as it serves as a pivotal ratio for defining point B. Traders rely on this critical reference point to identify the Potential Reversal Zone (PRZ), a key area where price reversals are likely to occur within the pattern.
Bat Harmonic Pattern:
Scott Carney discovered the BAT pattern and named it after its bat-like shape. It consists of precise elements that identify Potential Reversal Zones (PRZs).
With one extra leg and an additional point called X, it distinguishes itself from the ABCD pattern. A retracement to point B at 50% of the initial XA movement indicates a BAT pattern.
Traders multiply the BC leg by a minimum factor of 1.618 to determine the length of the CD extension in harmonic patterns. Traders look for potential price reversals or inversions at the endpoint (D), which forms the Potential Reversal Zone (PRZ).
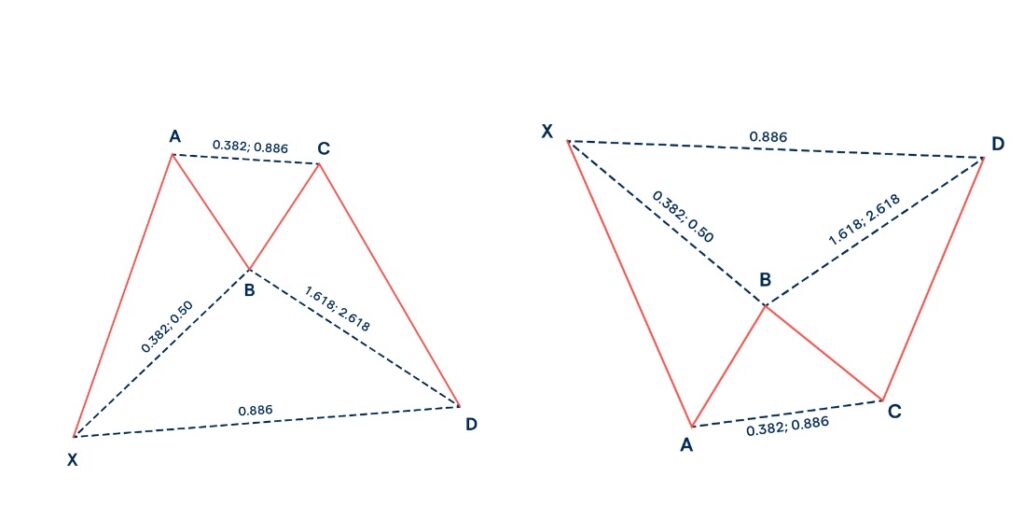
The Crab Harmonic Pattern:
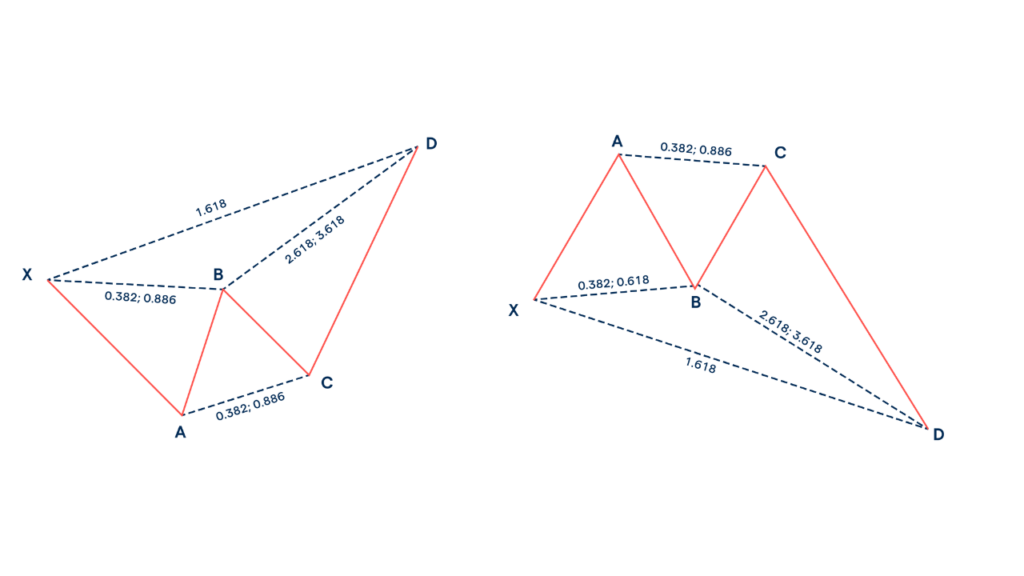
The Crab pattern, discovered by Scott Carney, is a chart pattern that helps traders identify potential market extremes. It consists of four legs labeled X-A, A-B, B-C, and C-D. The key feature of the pattern is the 1.618 extension of the XA movement, which defines the Potential Reversal Zone (PRZ). In a bullish Crab pattern, the price sharply rises from point X to point A, followed by a retracement of AB. Traders extend the BC projection to extreme levels (2.618 – 3.14 – 3.618) in order to identify a potential trend reversal area. In a bearish Crab pattern, the price drops from point X to point A, followed by a moderate rise, slight drop, and a sharp rise to point D.
Shark Harmonic Pattern:
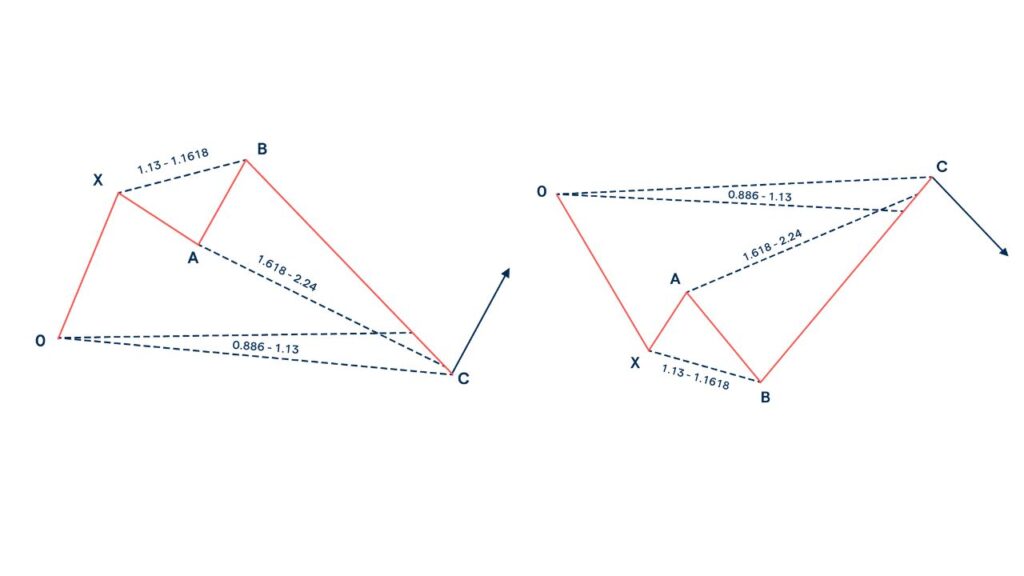
Scott Carney also discovered the shark pattern, which exhibits certain similarities to the Crab pattern. The five-leg reversal pattern receives labeling as O, X, A, B, and X.
To confirm a shark pattern, three Fibonacci rules must be satisfied.
1. The AB leg should retrace between 1.13 and 1.618 of the XA leg.
2. The BC leg should be 113% of the OX leg.
3. The CD leg targets 50% of the Fibonacci retracement of the BC leg.
Shark pattern trades are based on point C, while point D serves as the predetermined profit target.
ABCD Harmonic Pattern:
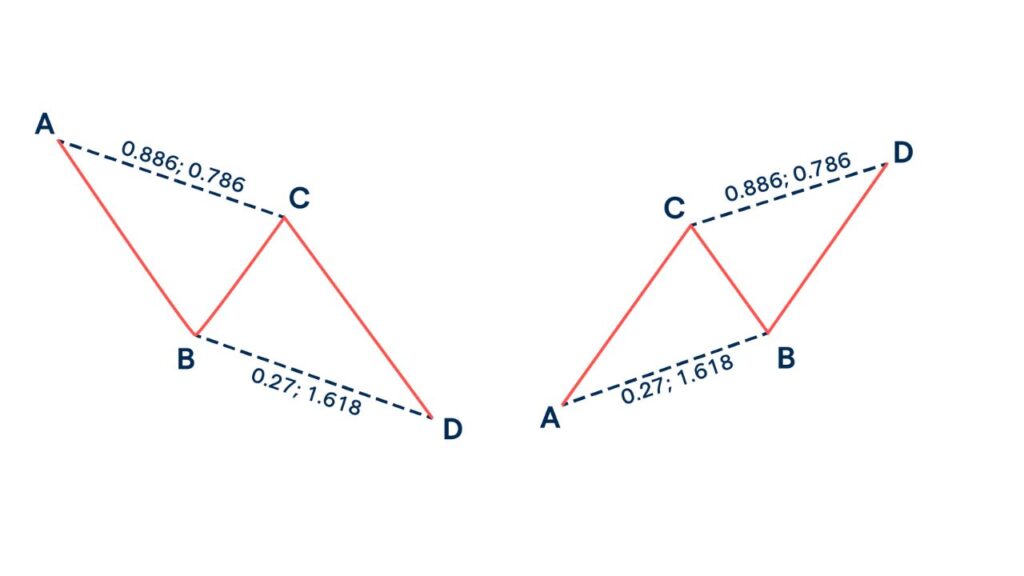
The ABCD pattern is a simple chart pattern consisting of three movements and four points. It involves an impulsive movement (AB), followed by a corrective movement (BC), and another impulsive movement (DC) in the same direction. Traders use Fibonacci retracement on the AB leg, with the BC leg ideally reaching the 0.618 level. The CD line matches the length of AB, and the time from A to B should be equal to the time from C to D. Traders can enter near the C point (Potential Reversal Zone) or wait for the pattern to complete at the D point.
Gartley Harmonic Pattern:
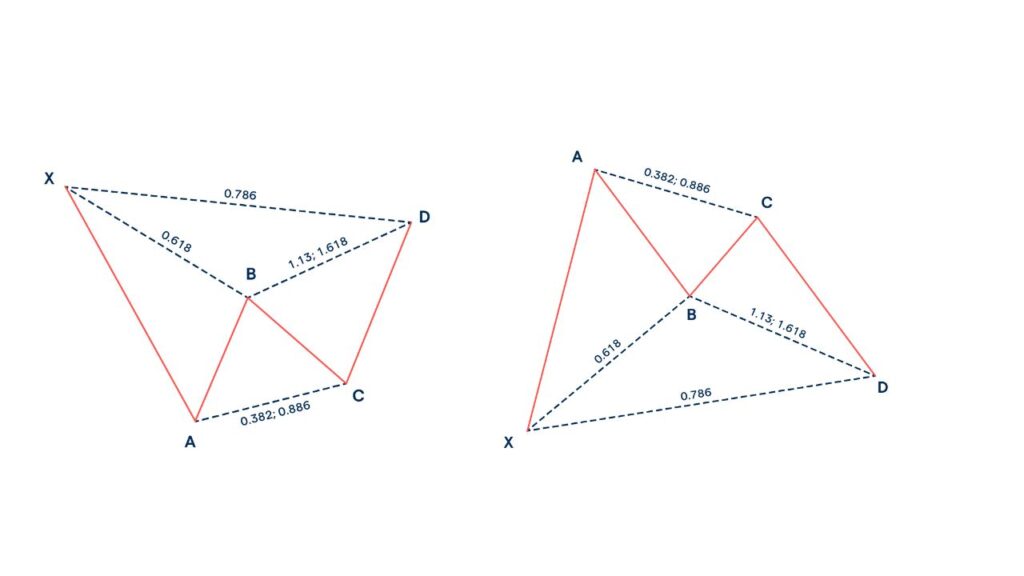
The Gartley pattern, initially described by H.M. Scott Carney added Fibonacci levels to the Gartley pattern in his book “The Harmonic Trader,” expanding on Gartley’s original concept in “Profits in the Stock Market.” The bullish pattern suggests the end of corrective waves and indicates an upcoming upward move. Traders should consider the broader trend or range. In the bullish example, price reaches point A, corrects with a 0.618 retracement at point B, moves up with a 0.382 to 0.886 retracement of AB at point C, and then moves down with a 1.13 to 1.618 extension of AB at point D.
Point D represents the potential reversal zone, presenting an opportunity to consider long positions while confirming rising prices.
The bearish pattern involves short trades near point D, with a stop loss placed above.
How to Enter and Exit the Stock Market with Harmonic Patterns?
Traders can utilize each pattern to identify a potential reversal zone (PRZ) that may not indicate an exact price level.
Two projections form point D. Traders can enter a position if the projected levels align closely.
When the projection zone is wide, ensure price movement confirmation through indicators or close monitoring.
To manage risk effectively, traders can place a stop loss outside the furthest projection.
Traders protect their trades by implementing this measure against extended and invalidated patterns.
Conclusion.
Mastering the patterns of harmonic trading requires traders to dedicate time, practice, and conduct thorough research. It is a precise and systematic approach that emphasizes the importance of fundamental measurements. Traders should be cautious as any movements that deviate from the correct pattern measurements invalidate the pattern and can lead them astray.
Traders actively seek patterns like the Gartley, butterfly, bat, crab, and shark.
Upon receiving price confirmation indicating a reversal, traders enter positions within the potential reversal zone. They strategically place stop losses just below long entries or above short entries, or alternatively outside the pattern’s furthest projection.
Also, Check our Blog on RBI’s Withdrawal of ₹2000 Currency.
Want to Learn How to do Trading in Live Market? With systematic Trading Strategy on the Day of Expiry. *Click Here To Know*

Disclaimer: The information provided in this Blog is for educational purposes only and should not be construed as financial advice. Trading in the stock market involves a significant level of risk and can result in both profits and losses. Spider Software & Team does not guarantee any specific outcome or profit from the use of the information provided in this Blog. It is the sole responsibility of the viewer to evaluate their own financial situation and to make their own decisions regarding any investments or trading strategies based on their individual financial goals, risk tolerance, and investment objectives. Spider Software & Team shall not be liable for any loss or damage, including without limitation any indirect, special, incidental or consequential loss or damage, arising from or in connection with the use of this blog or any information contained herein.