The movement of price of a stock plotted over time is called Price action.
What is Price action?
It forms the basis for all technical analysis of stock, commodity or other asset charts. Many short-term traders rely solely on price action and the resulting formations and trends to make trading decisions. Technical analysis as a practice derives from price action as it utilizes past prices in calculations that inform trading decisions.
What is Price action trading?
Price action trading is a “pure” form of technical analysis as it does not contain any secondary price derived indicators.Price action traders focus solely on the first-hand data generated by the market itself, which is the price movement over time.Price action trading is also sometimes referred to as “pure chart trading”, “naked trading”, “raw or natural trading”, referring to trading from a simple price chart with only price action.
it is much easier to analyse the market and trade based on its price action than to try to decipher and sort through the many different variables that affect the market every day.
Key points to look for in Price action trading
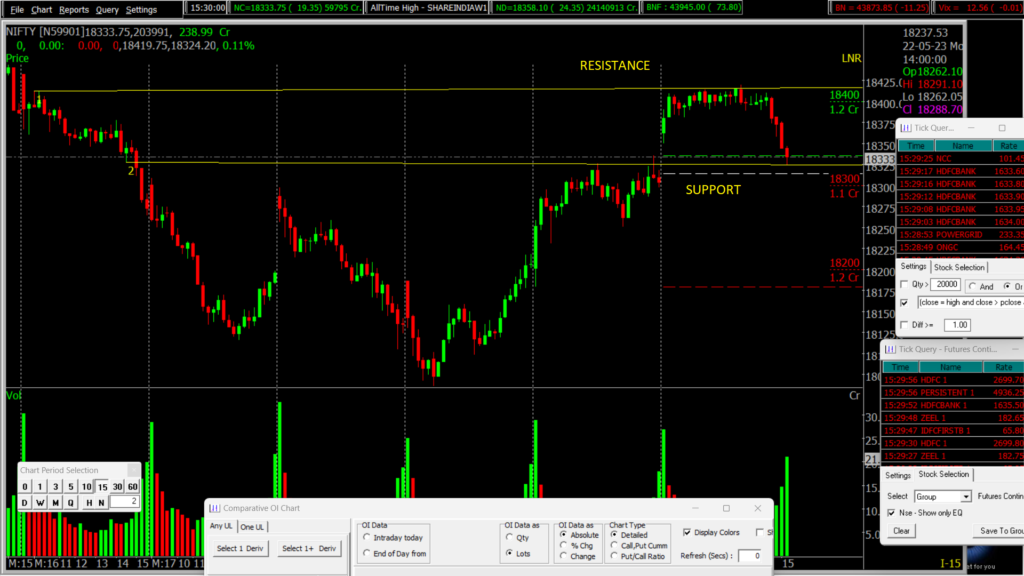
Support and Resistance:
Support refers to a price level or zone where there is enough buying demand to prevent the price of an asset from declining further.Buyers entering the market at support levels create upward pressure, causing the price to bounce back or “find support.”. Traders often look for support levels as potential buying opportunities, expecting the price to reverse or show increased buying interest at these levels. Resistance, on the other hand, is a price level or zone where there is enough selling supply to prevent the price of an asset from rising further. It is a level at which sellers tend to emerge and create downward pressure, causing the price to stall or “encounter resistance. Traders often pay attention to resistance levels as potential areas to sell or take profits, expecting the price to reverse or face increased selling pressure at these levels.
Trendlines:
Traders use trendlines as graphical tools to identify and visualize price trends in trading. They connect significant price points and show the direction and strength of the trend. In an uptrend, trendlines connect higher lows, indicating buying pressure. In a downtrend, trendlines connect lower highs, indicating selling pressure. Traders use trendlines to find buying or selling opportunities and manage risk.
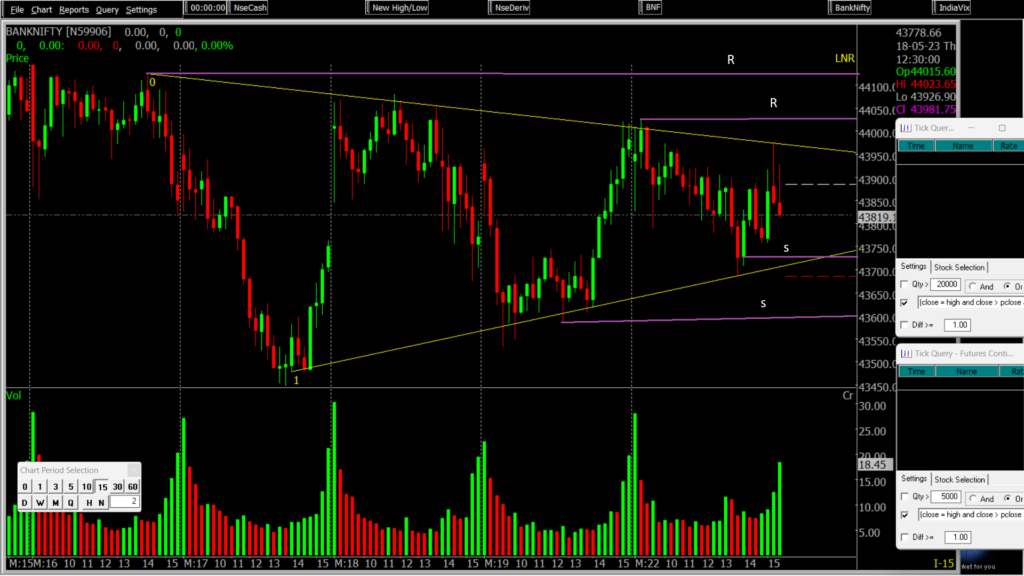
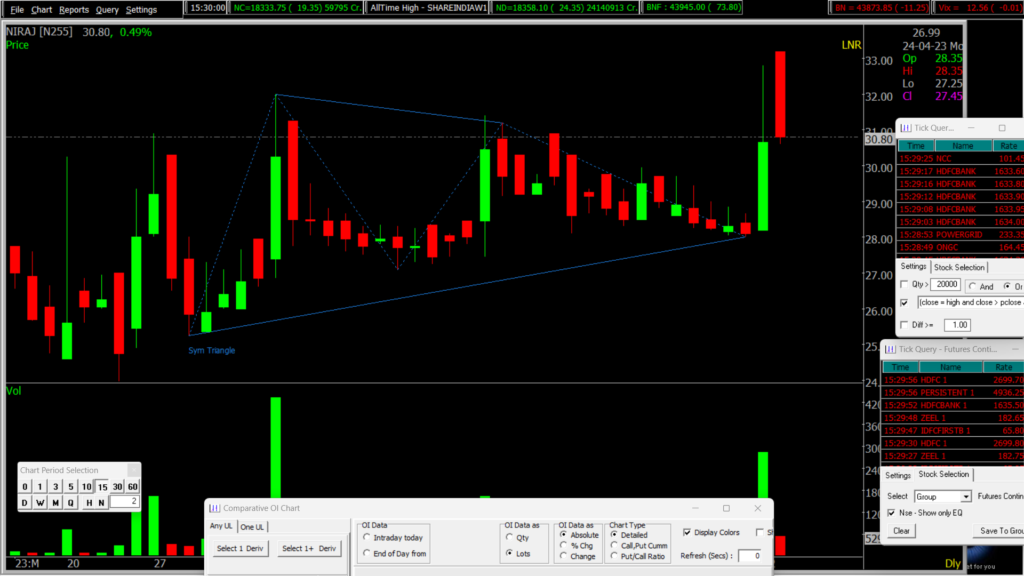
Chart Pattern:
Chart patterns in trading are formations on price charts that provide insights into potential future price movements. There are two main types: continuation patterns and reversal patterns. Continuation patterns suggest the current trend will continue, while reversal patterns indicate a potential trend reversal. Traders use these patterns to make trading decisions based on the shape and characteristics of the pattern.
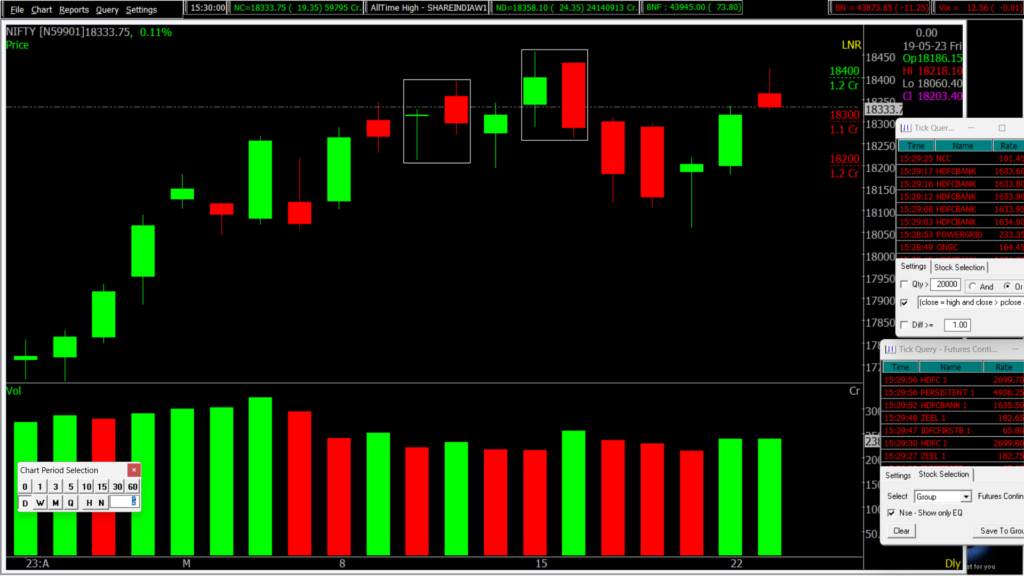
Candlestick Patterns:
Candlestick patterns are graphical representations of price movements on a financial chart. They provide information about opening, closing, high, and low prices. Patterns are formed by the arrangement of multiple candlesticks and are used by traders to predict future price movements and interpret market sentiment. Common patterns include doji, hammer, shooting star, engulfing patterns, and spinning top. Traders combine candlestick patterns with other analysis tools and confirmations for better decision-making.
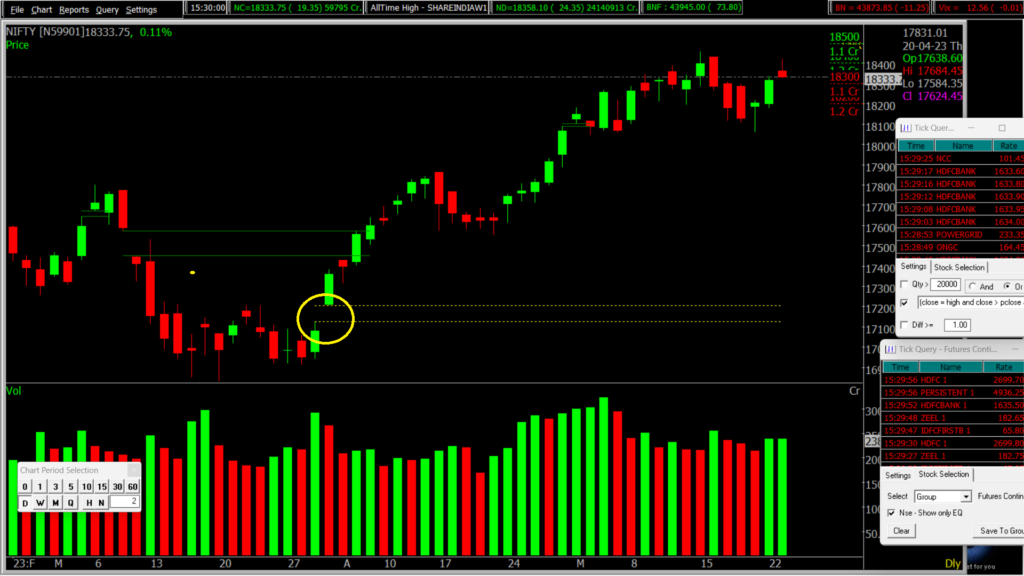
Gap filling on charts:
Gap filling on charts occurs when a price movement closes a gap between the closing price of one trading period and the opening price of the next period.News events or changes in market sentiment can cause gaps, which can be either upward or downward. Traders monitor gap filling as it may indicate support or resistance levels and potential future price movements. However, it is not a guaranteed predictor, and other analysis tools are typically considered alongside gap filling
Conclusion :
Price action trading has been one of the best strategies of traders for centuries. When you trade price action, you ignore everything and make trading decisions based on price. Your job is to analyse how the charts are moving right now and determine future price movements based purely on that. As a price action trader, you can trade using either trends, patterns, or both. But don’t use it as a shortcut to trading. Price Action trading has its flaws and there is risk involved in trading. Have a solid risk management strategy to avoid losses and implement price action trading with proper framework.
Want to Learn How to do Trading in Live Market? With systematic Trading Strategy on the Day of Expiry.

Disclaimer: The information provided in this Blog is for educational purposes only and should not be construed as financial advice. Trading in the stock market involves a significant level of risk and can result in both profits and losses. Spider Software & Team does not guarantee any specific outcome or profit from the use of the information provided in this Blog. It is the sole responsibility of the viewer to evaluate their own financial situation and to make their own decisions regarding any investments or trading strategies based on their individual financial goals, risk tolerance, and investment objectives. Spider Software & Team shall not be liable for any loss or damage, including without limitation any indirect, special, incidental or consequential loss or damage, arising from or in connection with the use of this blog or any information contained herein.