
Momentum Indicators in the stock market gauge the strength and speed of price movements, offering insights into overbought/oversold conditions and possible trend reversals. Traders rely on these Momentum indicators to make informed decisions using historical price data.
What are Momentum Indicators?

Momentum Indicators play a crucial role in assessing the speed of price changes for individual stocks. Indicators reveal price strength, aiding trend analysis for both upward and downward movements.
Momentum Indicators, widely used in technical analysis, measure price fluctuation rates and complement volume and volatility indicators. It’s important to note that these indicators are particularly valuable in a rising market.
The momentum Indicator formula involves comparing the latest closing price with the previous closing price of any selected time frame. The momentum Indicator is usually shown below the price chart as a separate line, not overlapping with the price.
How to use the Momentum Indicator?
Momentum indicators serve as valuable tools for generating trade signals, but their true strength lies in confirming the validity of trades based on price actions like breakouts or pullbacks.
Traders can trade with these indicators by using the ways like:
- Crossovers: Momentum indicators generate trade signals when they intersect the middle line or other designated lines. For instance, when utilizing the Moving Average Convergence Divergence (MACD) indicator, a buying signal occurs when the MACD line crosses the signal line either from above or below.
- Divergence: There are 2 types of Divergence, Bullish & Bearish.
In Bullish Divergence, the price keeps going down but the momentum indicator starts going up. This suggests that even though the price is falling, the selling pressure is weakening, and a possible trend reversal to an upward direction may occur.
The price keeps rising to new highs in Bearish Divergence, but the momentum indicator starts moving lower. This indicates that despite the upward price movement, the buying momentum is decreasing, and there is a possibility of a trend reversal to the downside.
The Most Common Momentum Indicators are:
These momentum indicators are commonly used by traders to assess price speed:
Relative Strength Index (RSI):
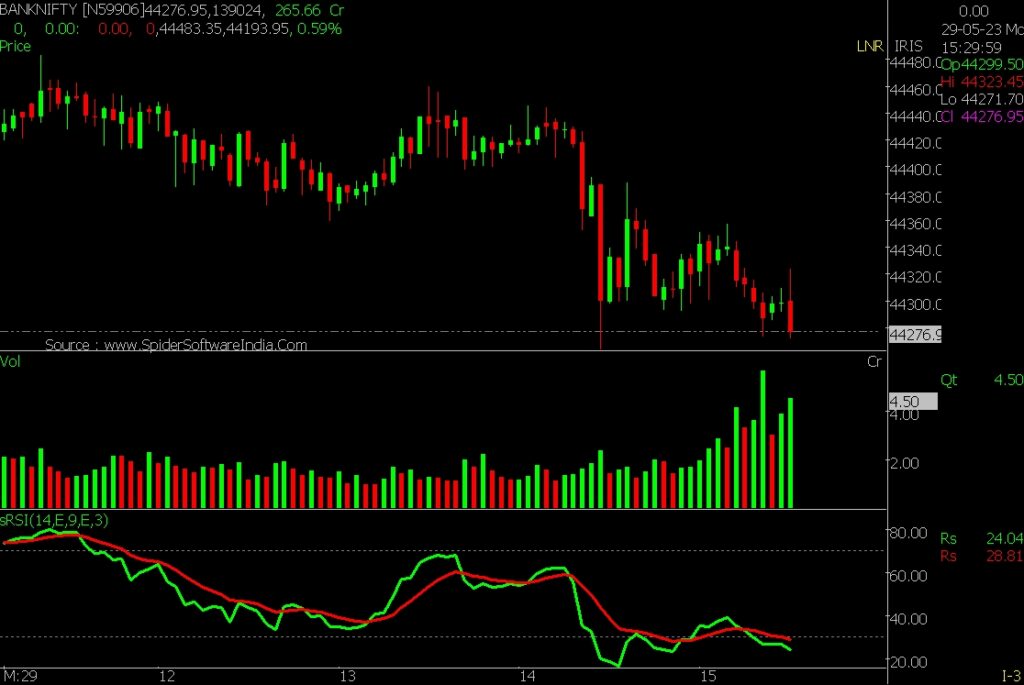
Traders commonly use the Relative Strength Index (RSI) as a momentum indicator to measure changes in prices and determine the speed of those changes over a specific period. Traders can identify signals by observing divergences and crossovers of the centerline, set at 50, as the indicator ranges between zero and 100.
When the RSI crosses above 50, it indicates positive momentum and an uptrend. RSI at 70 or higher indicates an overbought stock.
Conversely, when the RSI crosses below 50, it indicates negative momentum and a downtrend.
RSI below 30 indicates an oversold stock.
Stochastic Oscillator:
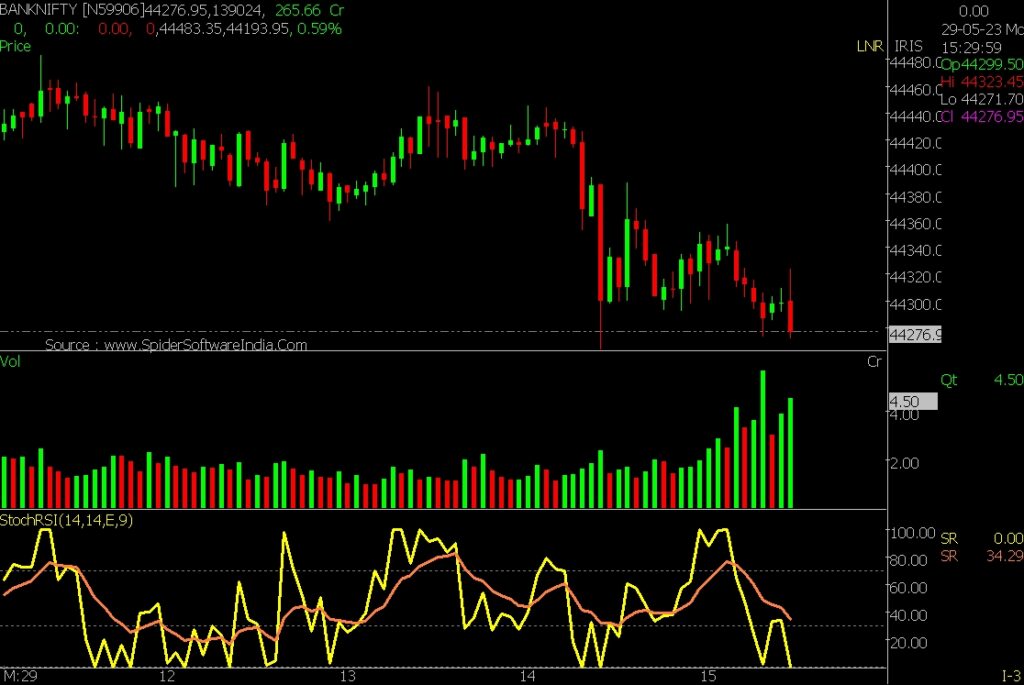
Traders use this momentum indicator to compare a stock’s current closing price within a specific timeframe. It focuses on tracking market momentum and speed, disregarding volume and price.
Stochastics assists in identifying overbought and oversold zones, ranging between 0 and 100. An indicator above 80 indicates an overbought zone, while a value below 20 signifies an oversold zone.
Average Directional Index (ADX):
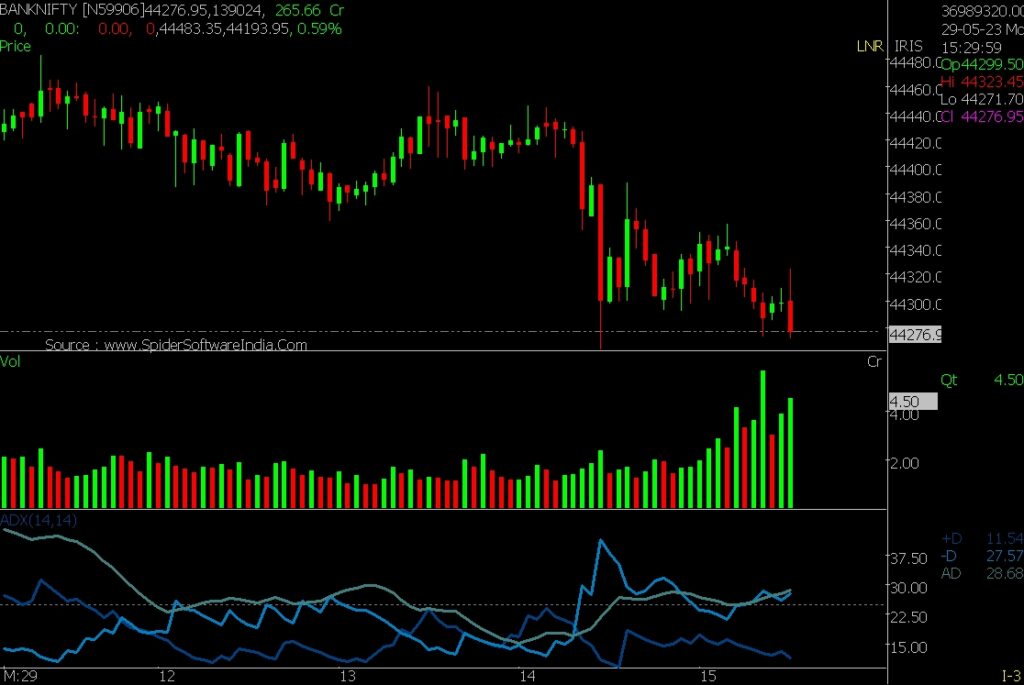
The Average Directional Index (ADX), developed by Welles Wilder, is part of the Directional Movement System, which includes the ADX, the Minus Directional Indicator (-DI), and the Plus Directional Indicator (+DI).
These indicators collectively assist in measuring both the momentum and direction of price movements.
Traders should remember that ADX values of 20 or higher indicate a trending market, while values below 20 suggest a “directionless” or consolidated market.
Moving Average Convergence Divergence (MACD):
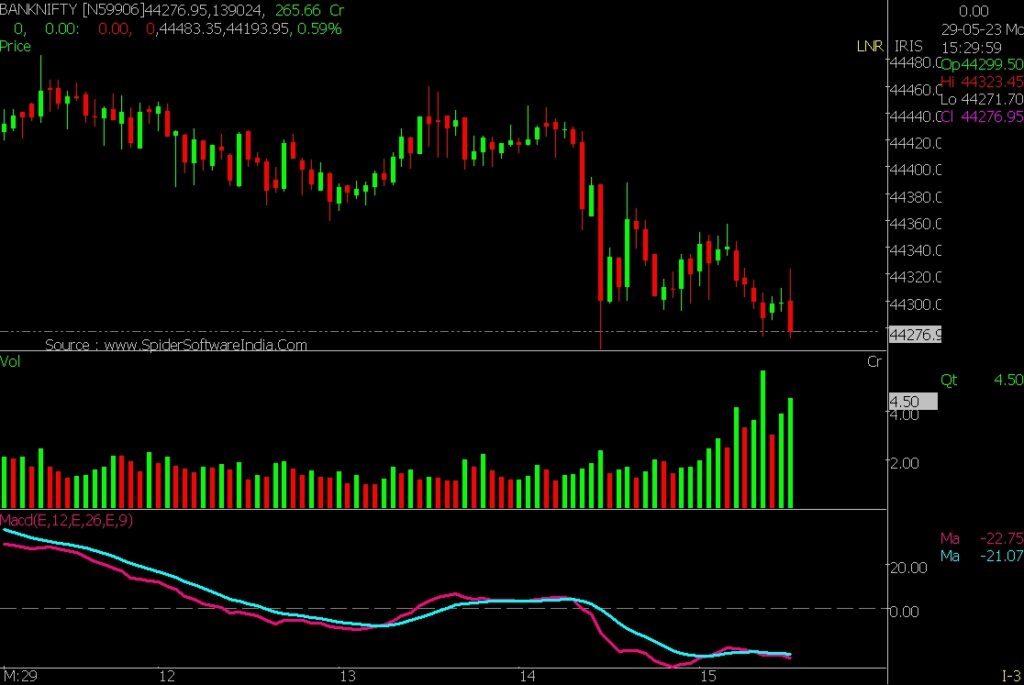
MACD, a momentum indicator, reveals the connection between two moving averages: the 26 EMA and 12 EMA.
It comprises two lines: the MACD line (the difference between the 26 EMA and 12 EMA) and the signal line (9 EMA).
A buying signal occurs when the MACD line crosses above the signal line, while a selling signal occurs when the MACD line crosses below the signal line.
What are the Benefits of using Momentum indicators:
Momentum indicators provide insights into the strength and future potential of price movements, regardless of their direction (up or down). They are particularly valuable in identifying market reversals by detecting divergences between price movement and momentum.
To fully utilize momentum indicators, it is beneficial to combine them with other technical indicators, such as trend lines and moving averages, which provide information on price trends and directions.
Using momentum indicators alongside other tools empowers traders and analysts to make informed decisions and understand market price dynamics.
To Sum Up.
Momentum indicators are vital in trading, often used with other indicators to determine price trend direction. Once the trend direction is established, momentum indicators help assess the strength of price movements and identify potential trend reversals. By integrating momentum indicators with other technical tools, traders gain market insights for informed decision-making.
Also, Check our Blog on How to trade Futures & Options in BSE.
Disclaimer: The information provided in this Blog is for educational purposes only and should not be construed as financial advice. Trading in the stock market involves a significant level of risk and can result in both profits and losses. Spider Software & Team does not guarantee any specific outcome or profit from the use of the information provided in this Blog. It is the sole responsibility of the viewer to evaluate their own financial situation and to make their own decisions regarding any investments or trading strategies based on their individual financial goals, risk tolerance, and investment objectives. Spider Software & Team shall not be liable for any loss or damage, including without limitation any indirect, special, incidental or consequential loss or damage, arising from or in connection with the use of this blog or any information contained herein.