Swing trading strategies aim to profit from short- to medium-term price swings without constant monitoring.

Swing trading is a trading approach where investors seek to profit from price fluctuations in the stock market or other financial markets over several days or weeks.
The primary objective of swing trading strategies is to achieve short- to medium-term profits by leveraging the natural ‘swings’ in stock prices. Unlike day trading, this method does not require continuous monitoring and frequent trades throughout the day.
Unlike day traders, who close their positions before the trading day ends, swing traders keep their trades open for several days or even weeks. Their goal is to make profits by following market trends, reversals, or momentum. For instance, if a stock is on an upward trend, a swing trader might buy during a temporary dip and sell when the price rises again to its peak.
Swing traders study charts and indicators to spot patterns like price levels where a stock tends to rise or fall, moving averages, or signs of momentum. They also look at things like market trends, how different sectors are performing, and the overall economy before making trading decisions.
5 Best Swing Trading Strategies
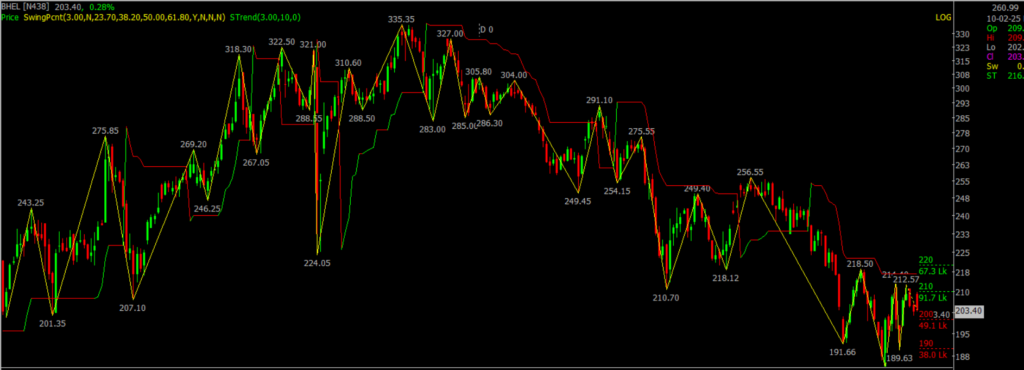
1. Trend Following
A common swing trading strategy is trend following, where traders buy stocks that are moving upward and sell them once they reach a target profit or begin to drop.
How It Works
- Buying During Dips: Traders enter a trade when a stock temporarily drops within an overall upward trend. For example, if the stock’s 50-day moving average is steadily increasing, buying during small price drops can be a good opportunity, as the stock is expected to rise again.
- Buying Breakouts: This involves purchasing stocks when they move past previous high levels. The idea is that once a stock breaks above its past peak, more buyers may step in, pushing the price even higher.
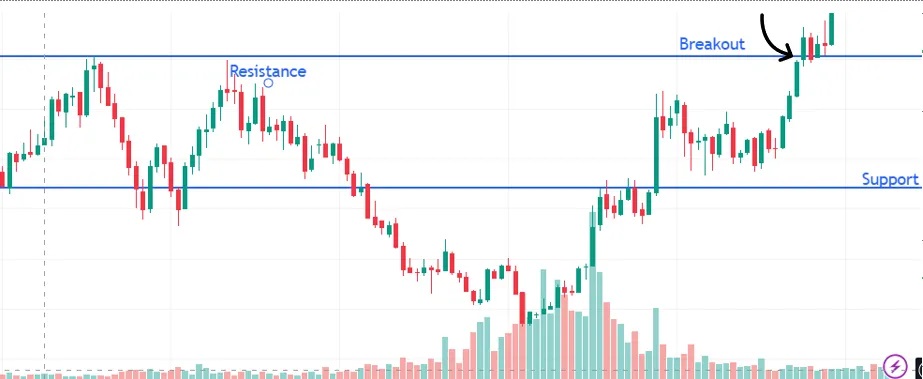
2. Breakout Strategy
This strategy means buying stocks when their price rises past a resistance level and selling when they drop below a support level. A breakout happens when the stock moves beyond these key price points.
How to Apply It
- Identifying Swing Highs and Lows: Analyze stock charts to find swing highs (resistance) and swing lows (support). If a stock breaks above a swing high, it could keep rising, making it a strong buy opportunity.
- Confirming Breakouts: Check trading volume to validate breakouts. A breakout with high volume suggests strong market interest and increases the likelihood of the trend continuing.
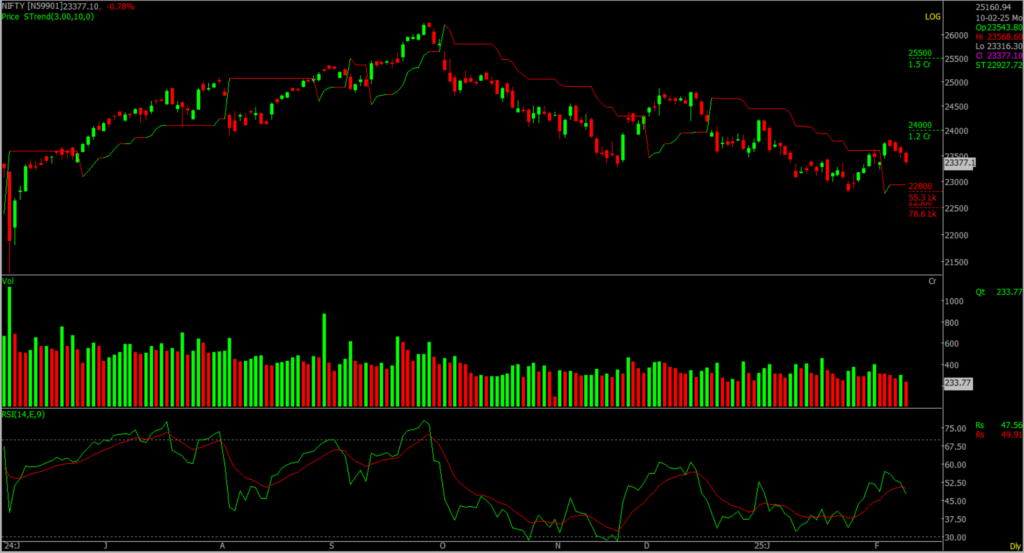
3. Momentum Strategy
Momentum trading is about finding stocks that are rising quickly and jumping in to take advantage of the upward movement. Traders look for stocks that are gaining speed and try to profit from the trend.
How to Apply It
- Using Indicators: Tools like the RSI or Stochastic Oscillator help spot stocks gaining momentum. For example, if the RSI shows strong buying pressure, it could be a signal to buy.
- Following the Trend: Purchase stocks that are climbing and hold onto them until the momentum weakens or your profit goal is reached. This means staying in the trade as long as the price keeps moving in your favor.
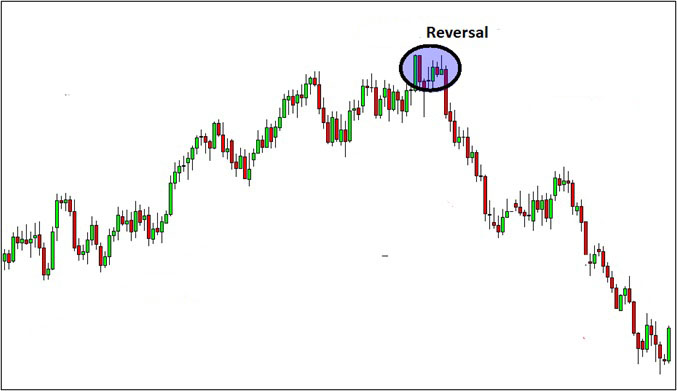
4. Reversal
Reversal trading is a strategy where traders buy stocks when their price direction begins to shift, either from falling to rising or vice versa. The goal is to enter the trade at the start of a new trend.
How to Apply It
- Using Indicators: Tools like MACD (Moving Average Convergence Divergence) or RSI help detect trend reversals. For instance, a bullish crossover in MACD may signal a shift from a downtrend to an uptrend.
- Choosing an Entry Point: Enter a trade when indicators suggest a trend is changing direction, and exit when signs of another reversal appear. This requires monitoring signals that the current trend is losing strength and a new one is forming.
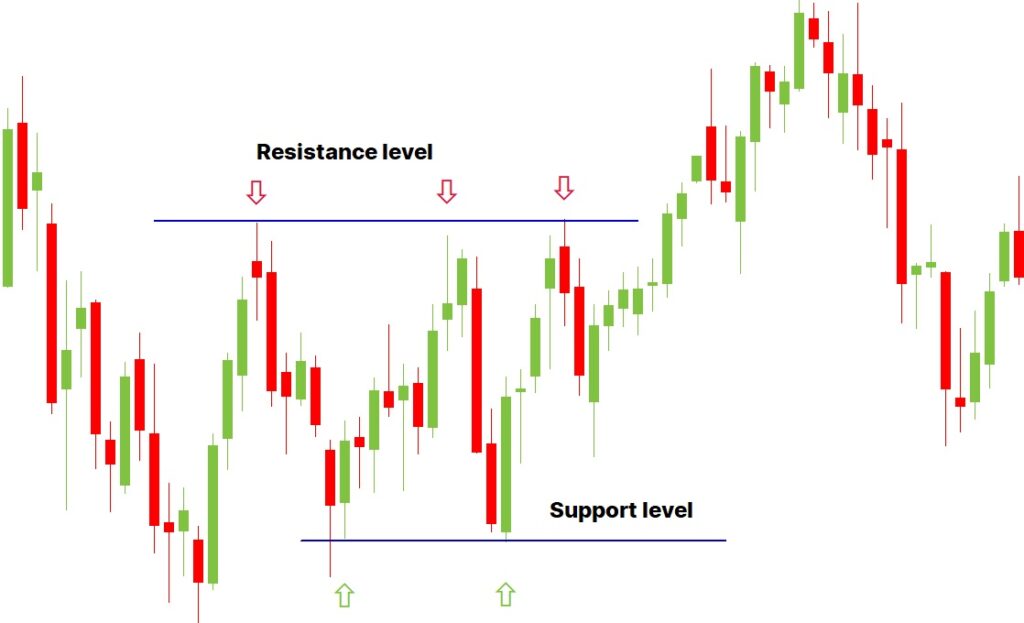
5. Resistance and Support
This strategy is about buying when a stock’s price is at a support level, where it usually stops falling and starts going up, and selling at a resistance level, where it often stops rising and begins to drop.
How to Apply It
- Support Level: Find a price level where a stock typically stops falling and moves back up. For instance, if a stock consistently rebounds around ₹500, buying near this point may be a good opportunity since it acts as strong support.
- Resistance Level: Identify a price where a stock frequently struggles to go higher and starts declining. For example, if a stock fails to break past ₹1000 multiple times, selling near this level makes sense due to strong resistance.
- Patterns: Watch for double bottoms (when a stock hits a low twice before climbing) or double tops (when it reaches a high twice before dropping). These patterns help confirm strong support or resistance zones.
In just 10 months since the launch of the India AI Mission, the IT Ministry has received an unprecedented response, successfully establishing a cutting-edge, robust common computing facility with approximately 18,693 Graphic Processing Units (GPUs). This is nearly nine times the capacity of the Open Source Model DeepSeek and about two-thirds of what ChatGPT has. In response to media queries, the Union Minister stated that DeepSeek could be hosted on Indian servers after security checks. This would allow coders, developers, and designers to use its open-source code.
Power of Algorithms in Options Trading, Try Spider Now: Register Now
If you’d like to know how we analyze the market and provide accurate levels every day. then click on the Free Demo button below and change your trading life for good. 5X returns are possible in options trading If you have Spider Software in your trading system.
Disclaimer: The information provided in this Blog is for educational purposes only and should not be construed as financial advice. Trading in the stock market involves a significant level of risk and can result in both profits and losses. Spider Software & Team does not guarantee any specific outcome or profit from the use of the information provided in this Blog. It is the sole responsibility of the viewer to evaluate their own financial situation and to make their own decisions regarding any investments or trading strategies based on their individual financial goals, risk tolerance, and investment objectives. Spider Software & Team shall not be liable for any loss or damage, including without limitation any indirect, special, incidental or consequential loss or damage, arising from or in connection with the use of this blog or any information contained herein. ![]()