
In today’s stock market, Nifty falls below 25,200, Sensex drops 271 points, while metals perform well amid positive market sentiment today.
Stock Market Nifty Chart Prediction
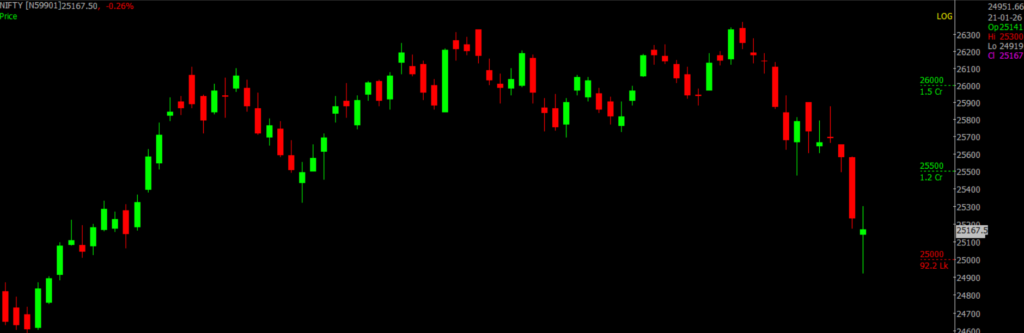
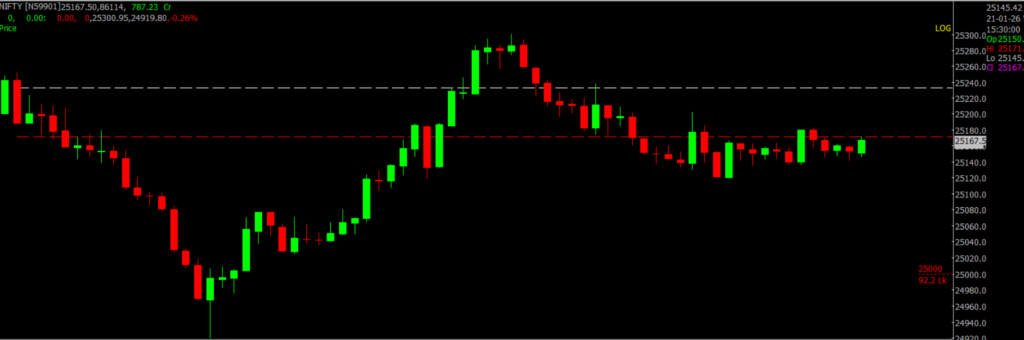
On Jan 21, Sensex was down 270.84 points at 81,909.63, and the Nifty was down 75 points at 25,157.50. About 1,357 shares advanced, 2,509 shares declined, and 127 shares remained unchanged.
Top Nifty gainers: Eternal, Max Healthcare, InterGlobe Aviation, Hindalco and JSW Steel
Top Nifty Losers :Trent, Bharat Electronics, ICICI Bank, Tata Consumer and Apollo Hospitals
Except for metal and oil & gas, all other sectoral indices ended in the red, with pharma, IT, private banks, realty and PSU banks declining about 0.5 percent each.
The BSE Midcap and Smallcap indices shed nearly 1 percent each.
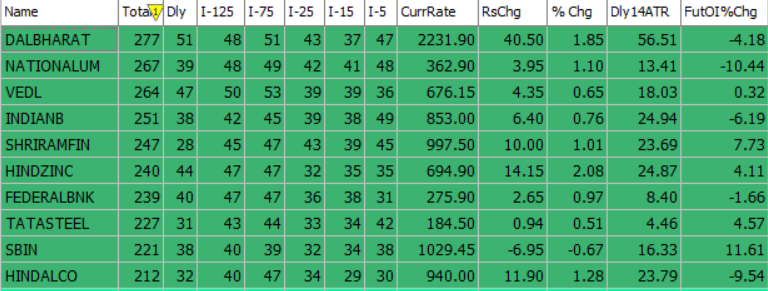
Best Stocks of the day according to AI (Delta Dash)
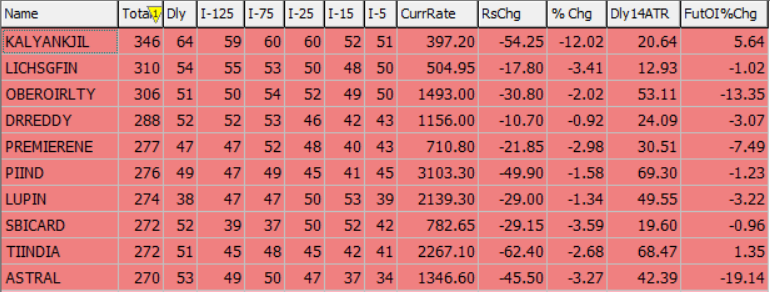
Worst Stocks of the day according to AI (Delta Dash)
Stock Prediction for 22nd January 2026
| STOCK | Good Above | Weak Below |
| MAXHEALTH | 1010 | 1000 |
| MFSL | 1628 | 1608 |
| NAUKARI | 1338 | 1325 |
| TECHM | 1695 | 1675 |
Prediction for Wednesday NIFTY can go up if it goes above 25,200 or down after the level of 25,000, but it also depends upon the Global cues.
Nifty traded with high volatility and a weak bias, closing 75 points lower after failing to sustain a mid-session recovery from around 24,900. The daily chart shows a doji-type candle with long shadows, indicating indecision and ongoing volatility. Such a formation after a decline may signal a potential reversal, but confirmation is required. Resistance is placed between 25,200 and 25,800, while support is seen in the 25,000–24,500 zone.
| Highest Call Writing at | 25,200 (1.5 Cr) |
| Highest Put Writing at | 25,000 (92.2 Lk) |
Nifty Support and Resistance
| Support | 25,000–24,500 |
| Resistance | 25,200 and 25,800 |
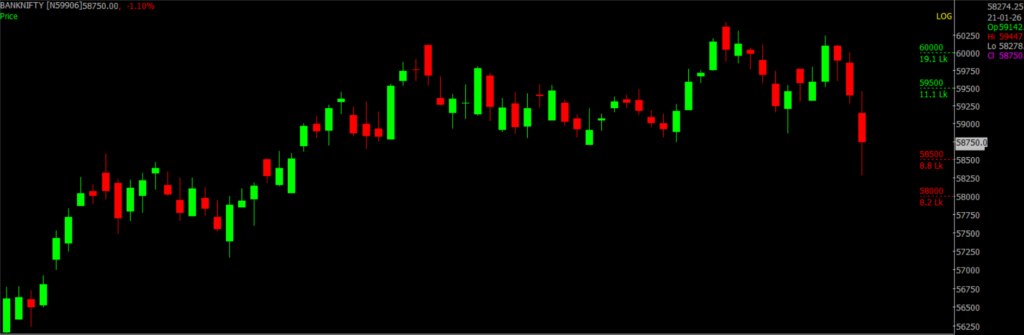
Bank Nifty Daily Chart Prediction
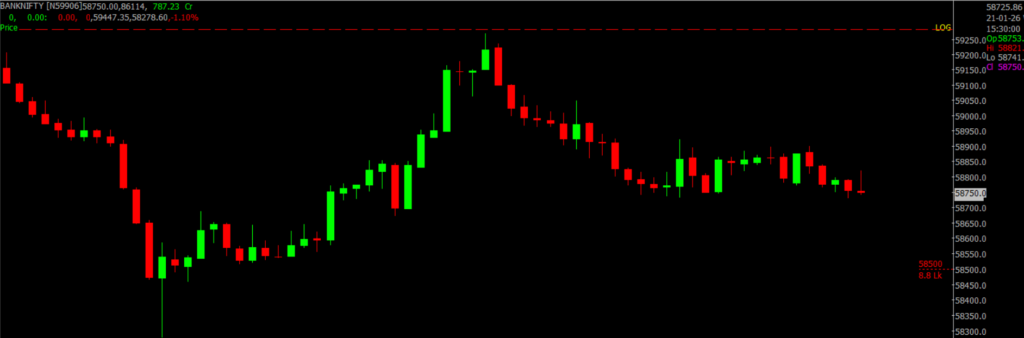
Prediction For Wednesday BANKNIFTY can go up if it goes above 59,000 or down after the level of 58,500, but it also depends upon the Global cues.
Bank Nifty, which had been comfortably trading above its upward-sloping trendline on the daily chart, eventually broke below it and closed the session at 58,800, registering a 1.02% decline.
The index has also slipped below its 50-day EMA at 59,040. Momentum indicators remain weak, with the RSI trending lower and hovering around the 40 mark. The DI- crossing below DI+ further indicates a gradual strengthening of bearish momentum. Unless Bank Nifty manages to decisively reclaim the 50-day EMA along with the broken trendline, the scope for a meaningful pullback appears limited. On the upside, resistance is seen in the 59,000–59,500 zone, while immediate support lies between 58,500 and 58,000.
| Highest Call Writing at | 59,000 (19.1 Lk) |
| Highest Put Writing at | 58,500 (8.8 Lk) |
Bank Nifty Support and Resistance
| Support | 58,500 and 58,000 |
| Resistance | 59,000–59,500 |
Voice Of Traders by Spider Software
HDFC Securities’ SECRET Stock Picking Formula! (STRATEGY REVEALED)

Disclaimer: The information provided in this Blog is for educational purposes only and should not be construed as financial advice. Trading in the stock market involves a significant level of risk and can result in both profits and losses. Spider Software & Team does not guarantee any specific outcome or profit from the use of the information provided in this Blog. It is the sole responsibility of the viewer to evaluate their own financial situation and to make their own decisions regarding any investments or trading strategies based on their individual financial goals, risk tolerance, and investment objectives. Spider Software & Team shall not be liable for any loss or damage, including without limitation any indirect, special, incidental or consequential loss or damage, arising from or in connection with the use of this blog or any information contained herein. ![]()