
In today’s stock market, Markets reverse 2-day rally; Nifty slips below 22,850, Sensex plunges 1,600 points.
Stock Market Nifty Chart Prediction
On March 27, Sensex was down 1,690.23 points at 73,583.22, and the Nifty was down 486.85 points at 22,819.60. About 765 shares advanced, 3,420 shares declined, and 123 shares were unchanged.
Top Nifty gainers: ONGC, TCS, Wipro, Bharti Airtel, and Coal India
Top Nifty Losers : Shriram Finance, Tata Motors Passenger Vehicles, InterGlobe Aviation, Reliance Industries, and Bajaj Finance
Broader markets mirrored the weakness, with the Nifty Midcap index dropping 2.2% and the Smallcap index declining 1.7%.
Auto, consumer durables, capital goods, and private banks fell 2% each.
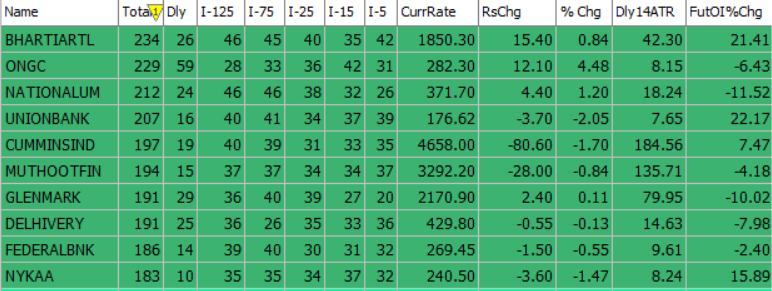
Best Stocks of the day according to AI (Delta Dash)
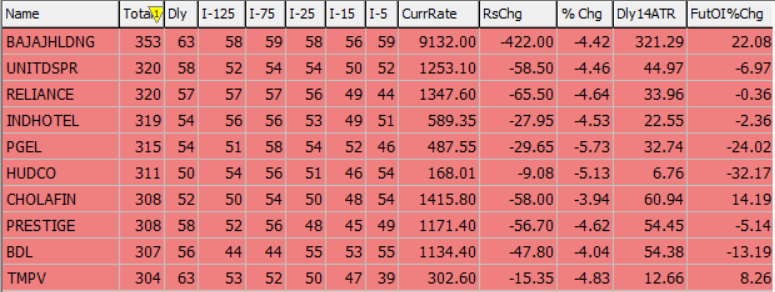
Worst Stocks of the day according to AI (Delta Dash)
Stock Prediction for 30th March 2026
| STOCK | Good Above | Weak Below |
| APLAPOLLO | 2010 | 1990 |
| BHARTIARTL | 1860 | 1840 |
| GLENMARK | 2180 | 2158 |
| LICHSGFIN | 510 | 504 |
Prediction for Monday NIFTY can go up if it goes above 23,100 or down after the level of 22,800, but it also depends upon the Global cues.
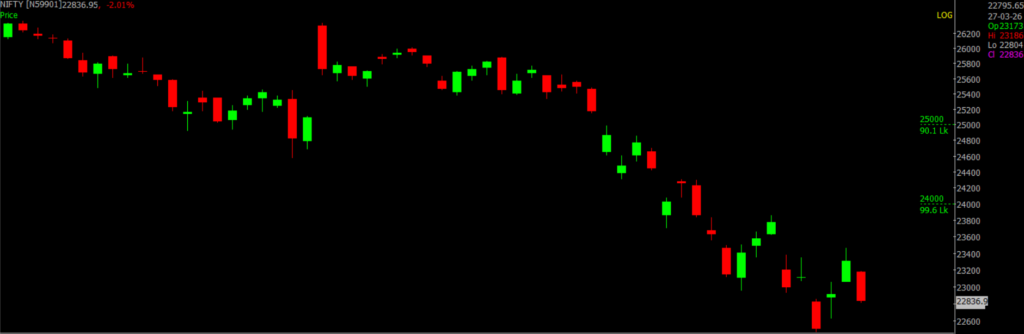
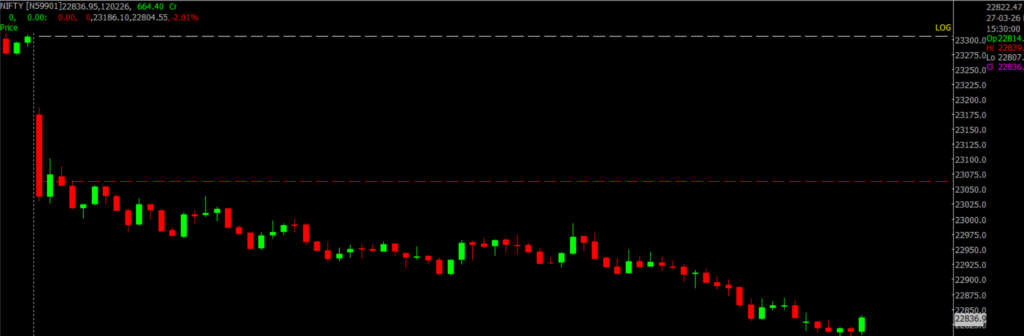
Nifty opened with a gap down and remained under pressure throughout the session, closing at 22,820.
After failing to cross the 23,350–23,400 resistance zone, the index witnessed fresh selling, continuing its bearish trend. Since early February, every rise has been sold into at higher levels.
On the technical front, RSI slipped after briefly crossing 40, indicating weakening momentum, while MACD remains below the zero and signal lines, reinforcing the bearish bias.
Resistance is placed between 23,100–23,600, while support is seen in the 22,800–22,600 zone.
| Highest Call Writing at | 23,100 (99.6 Lk) |
| Highest Put Writing at | 22,800 (95.0 Lk) |
Nifty Support and Resistance
| Support | 22,800–22,600 |
| Resistance | 23,100–23,600 |
Bank Nifty Daily Chart Prediction
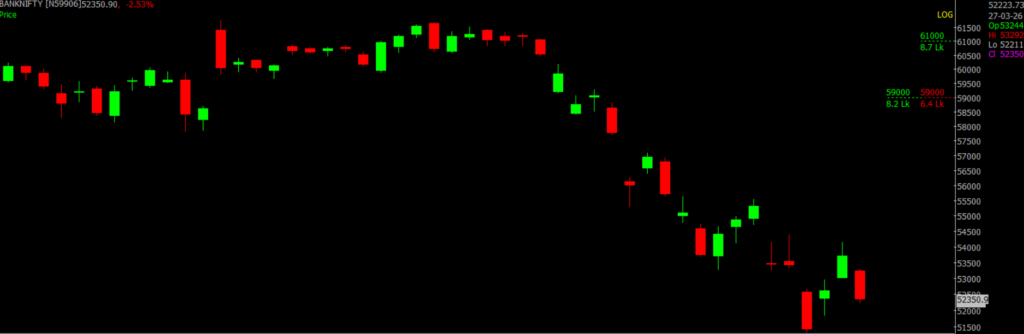
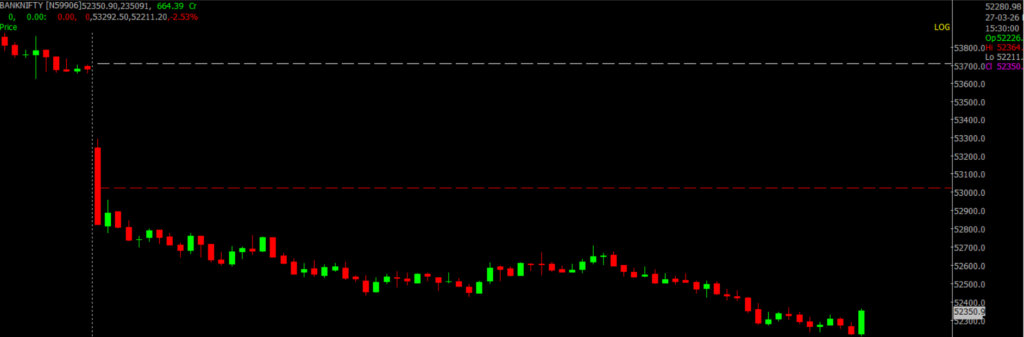
Prediction For Monday BANKNIFTY can go up if it goes above 52,300 or down after the level of 53,000, but it also depends upon the Global cues.
Bank Nifty mirrored the broader market weakness, opening with a gap down and extending losses to close at 52,275. The index has also posted a lower close on the daily chart.
The rising Nifty/Bank Nifty ratio indicates underperformance of Bank Nifty versus the benchmark. Additionally, it is positioned in the lagging quadrant of the RRG, signaling weak momentum and lack of relative strength.
Immediate support is placed in the 51,800–51,700 zone. A sustained break below this may drag the index towards 51,400, followed by 51,000 in the short term. Resistance is seen between 53,000–53,500, while near-term support lies in the 52,300–52,000 range.
| Highest Call Writing at | 53,000 (8.7 Lk) |
| Highest Put Writing at | 52,300 (6.4 Lk) |
Bank Nifty Support and Resistance
| Support | 52,300–52,000 |
| Resistance | 53,000–53,500 |
Voice Of Traders by Spider Software
He Lost ₹45L… Then Built the 1-Min ‘Elephant Candle’ Strategy (Setup Revealed)… (Full Strategy Explained)

Disclaimer: The information provided in this Blog is for educational purposes only and should not be construed as financial advice. Trading in the stock market involves a significant level of risk and can result in both profits and losses. Spider Software & Team does not guarantee any specific outcome or profit from the use of the information provided in this Blog. It is the sole responsibility of the viewer to evaluate their own financial situation and to make their own decisions regarding any investments or trading strategies based on their individual financial goals, risk tolerance, and investment objectives. Spider Software & Team shall not be liable for any loss or damage, including without limitation any indirect, special, incidental or consequential loss or damage, arising from or in connection with the use of this blog or any information contained herein. ![]()