

In today’s stock market, Sensex Plunges 1,500 Points from Day’s Peak; Nifty slips towards 23,500 amid heavy selling pressure.
Stock Marspin maya casinoket Nifty Chart Prediction
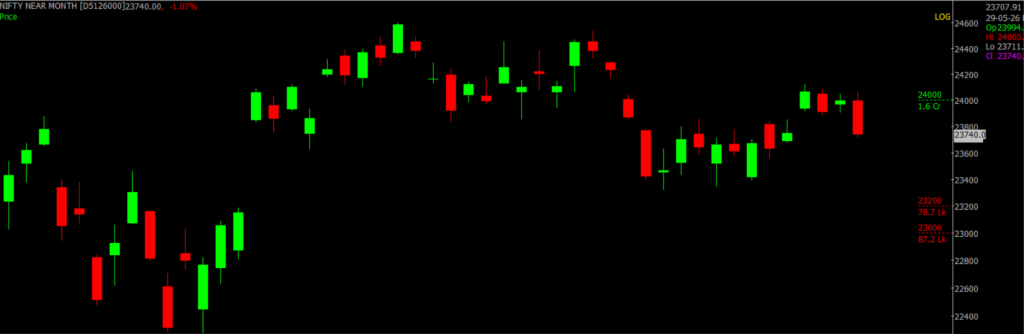
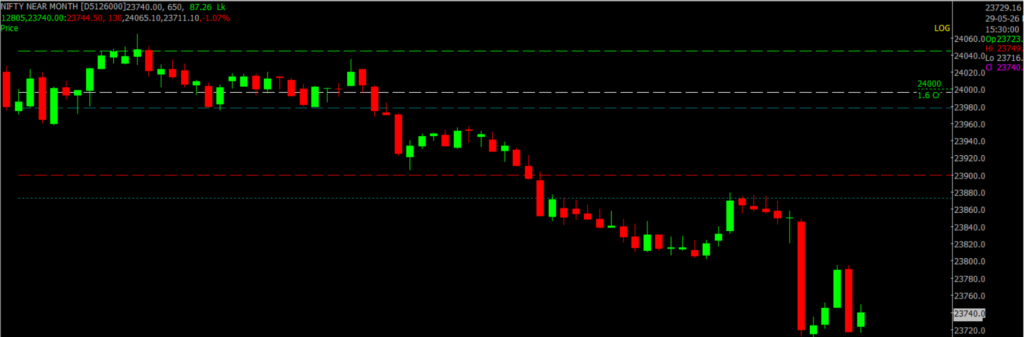
On May 29, Sensex was down 1,140.49 points at 74,727.31, while the Nifty fell 385.90 points to 23,521.25. About 1,480 shares advanced, 2,425 shares declined, and 155 shares remained unchanged.
Top Nifty gainers: Tech Mahindra, HCL Technologies, Wipro, and Larsen & Toubro
Top Nifty Losers : Eicher Motors, InterGlobe Aviation, Power Grid Corporation of India, Oil and Natural Gas Corporation, and Bajaj Auto
Among sectoral indices, all sectors except IT ended in the red. Auto, metal, energy, and oil & gas indices were the top laggards, each falling around 2 percent during the session.
Broader markets also remained under pressure, as the Nifty Midcap index declined 1.4 percent, while the smallcap index fell 1 percent.
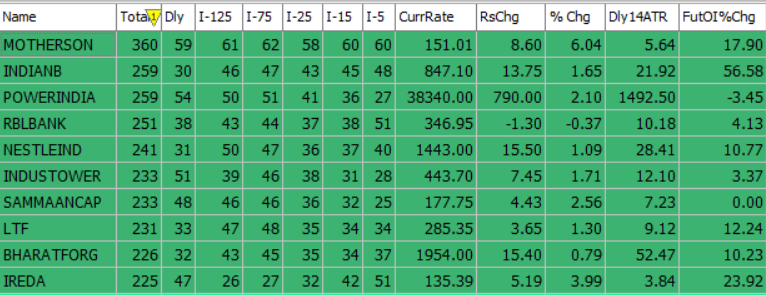
Best Stocks aviatorof the day according to AI (Delta Dash)
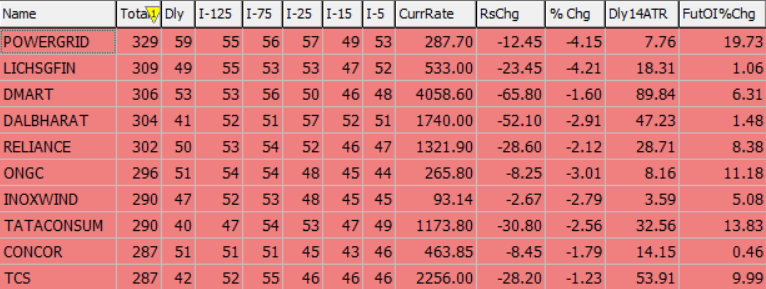
Worst Stocks of thteen pattie day according to AI (Delta Dash)
Stock Prediction for 1st June 2026
| STOCK | Good Above | Weak Below |
| INDIANB | 851 | 842 |
| PGEL | 484 | 478 |
| PIDILITIND | 1488 | 1472 |
| TECHM | 1485 | 1471 |
Prediction for Monday NIFTY can go up if it goes above 23,900 or down after the level of 23,500, but it also depends upon the Global cues.
Nifty continued to show weakness on the daily chart as it once again failed to close above its 50-day EMA, forming a sizeable bearish candle with a prominent upper wick. This marks the third straight session where the index has displayed a significant upper wick, highlighting persistent profit booking at higher levels and the market’s inability to sustain upward momentum. Meanwhile, the Midcap Index formed a bearish engulfing pattern, completely engulfing the previous session’s candle after rallying more than 5% over the last eight sessions, suggesting a possible pause in the recent uptrend. The Smallcap Index relatively outperformed its peers but also formed a sizeable bearish candle after two consecutive sessions of indecision, indicating a lack of strong follow-through buying and difficulty maintaining higher levels. Going forward, the resistance zone for Nifty is placed between 23,900 and 24,400, while immediate support is seen in the 23,500–23,100 range.
| Highest Call Writing at | 23,900 (1.6 cr) |
| Highest Put Writing at | 23,500 (71.7 Lk) |
Nifty Support and Resistance
| Support | 23,500–23,100 |
| Resistance | 23,900 and 24,400 |
Bank Nifty Daily Chart Prediction
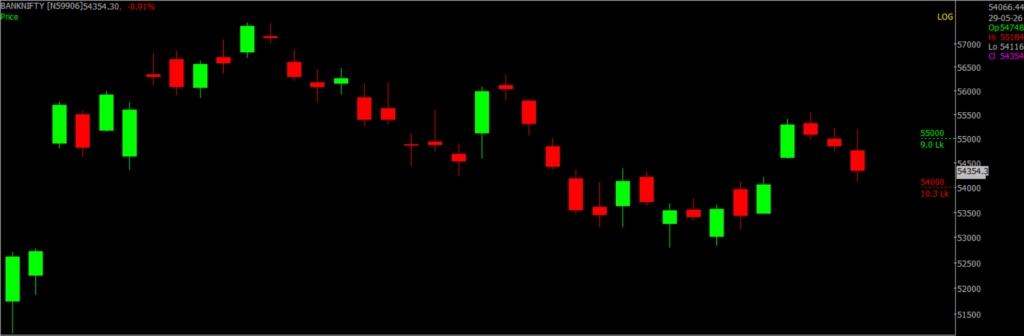
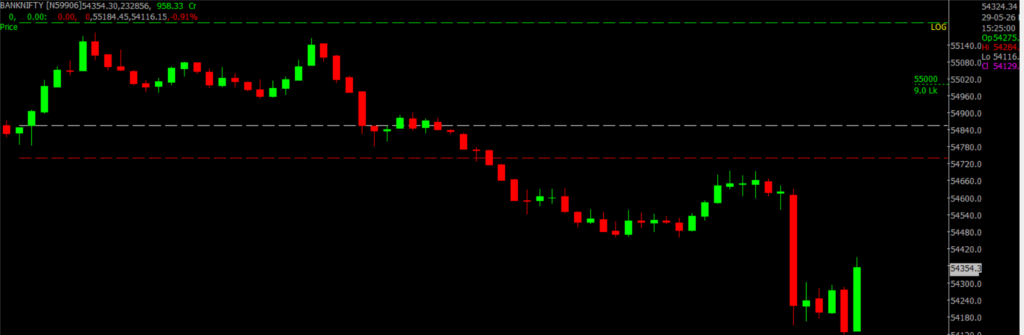
Prediction For Monday BANKNIFTY can go up if it goes above 54,300 or down after the level of 54,000, but it also depends upon the Global cues.
Bank Nifty traded in a narrow range of 55,184–54,761 during the first half of the session before witnessing a breakdown in the second half, which led to gradual selling pressure and dragged the index lower. It eventually closed at 54,239, registering a decline of 1.12% for the day. On the daily chart, Bank Nifty formed a sizeable bearish candle with a prominent upper wick, indicating its inability to sustain at higher levels. With the latest close, Bank Nifty has entered a negative trend and is likely to remain bearish as long as it trades below the 55,520 level on a closing basis. Traders may consider short positions with a daily closing stop-loss of 55,520. Going forward, the index faces resistance in the 54,300–55,000 zone, while immediate support is placed in the 54,000–53,500 range.
| Highest Call Writing at | 54,300 (9.0 Lk) |
| Highest Put Writing at | 54,000 (10.3 Lk) |
Bank Nifty Support and Resistance
| Support | 54,000–53,500 |
| Resistance | 54,300–55,000 |
Voice Of Traders by Spider Software
He Lost ₹45L… Then Built the 1-Min ‘Elephant Candle’ Strategy (Setup Revealed)… (Full Strategy Explained)

Disclaimer: The information provided in this Blog is for educational purposes only and should not be construed as financial advice. Trading in the stock market involves a significant level of risk and can result in both profits and losses. Spider Software & Team does not guarantee any specific outcome or profit from the use of the information provided in this Blog. It is the sole responsibility of the viewer to evaluate their own financial situation and to make their own decisions regarding any investments or trading strategies based on their individual financial goals, risk tolerance, and investment objectives. Spider Software & Team shall not be liable for any loss or damage, including without limitation any indirect, special, incidental or consequential loss or damage, arising from or in connection with the use of this blog or any information contained herein.