In today’s stock market, Nifty slips below 24,650, snapping a four-day winning streak as RBI policy remains in focus.
Stock Marspin maya casinoket Nifty Chart Prediction
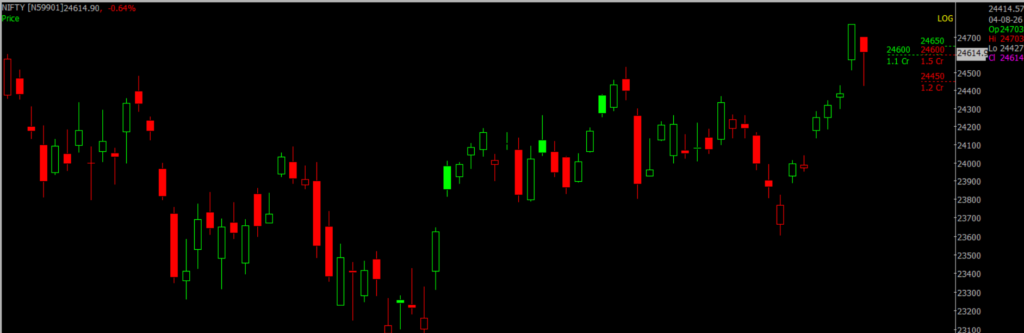
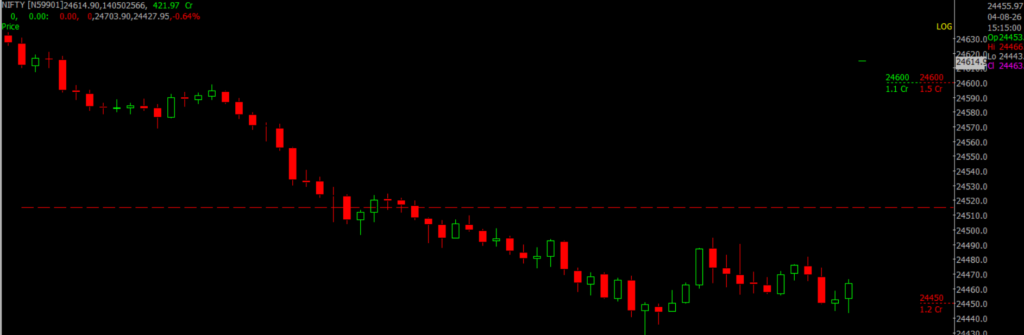
On August 4, The Sensex was down 210.08 points at 78,428.95, while the Nifty fell 159.40 points to 24,614.90. About 2,030 shares advanced, 2,037 shares declined, and 174 shares remained unchanged.
Top Nifty gainers : Grasim Industries, HDFC Life, Max Healthcare, Bajaj Auto, Reliance Industries,
Top Nifty Losers: Hindalco, Trent, Apollo Hospitals, Jio Financial and Eternal
Except for the Metal and Media indices, all sectoral indices closed lower. Information Technology, Oil & Gas, Realty, Infrastructure, Private Bank, Consumer Durables, and FMCG were among the top losers, declining between 0.5 and 2 points.
The Nifty midcap index shed 0.3 percent, while smallcap index was up 0.2 percent.
Best Stocks aviatorof the day according to AI (Delta Dash)
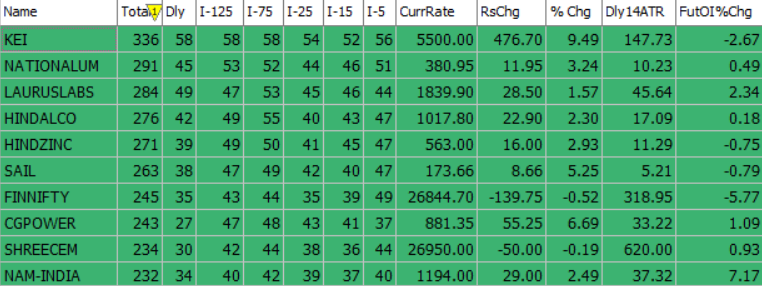
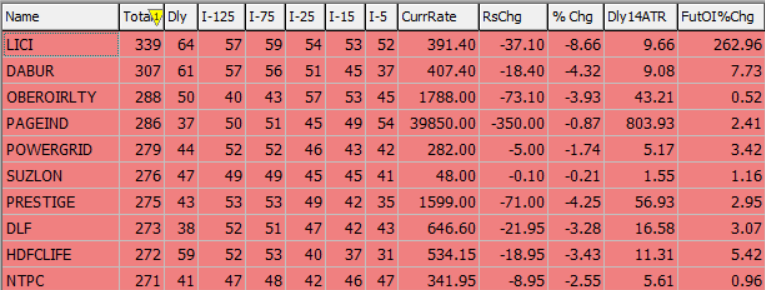
Worst Stocks of thteen pattie day according to AI (Delta Dash)
Stock Prediction for 5th August 2026
| STOCK | Good Above | Weak Below |
| AUROPHARMA | 1588 | 1248 |
| CGPOWER | 885 | 876 |
| HINDALCO | 1022 | 1012 |
| NAM-INDIA | 1200 | 1188 |
Prediction for Wednesday NIFTY can go up if it goes above 24,700 or down after the level of 24,500, but it also depends upon the Global cues.
The Nifty witnessed profit booking after a strong four-day rally, closing near 24,615 with a bearish candle, indicating some short-term weakness. However, the overall trend remains constructive as the index continues to trade above important support levels. Market participants are expected to remain cautious ahead of the RBI policy announcement, which could influence the next major move. On the upside, 24,700–25,000 will act as the immediate resistance zone, while 24,500–24,000 is expected to provide strong support in the near term.
| Highest Call Writing at | 24,700 (1.1 cr) |
| Highest Put Writing at | 24,500 (1.2 cr) |
Nifty Support and Resistance
| Support | 24,500–24,000 |
| Resistance | 24,700–25,000 |
Bank Nifty Daily Chart Prediction
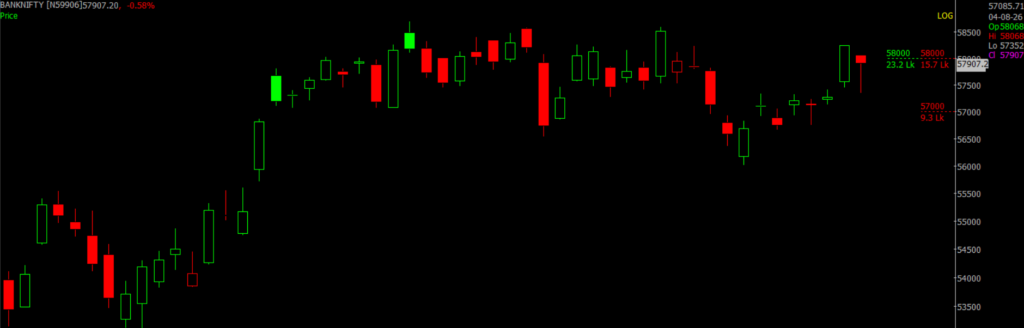
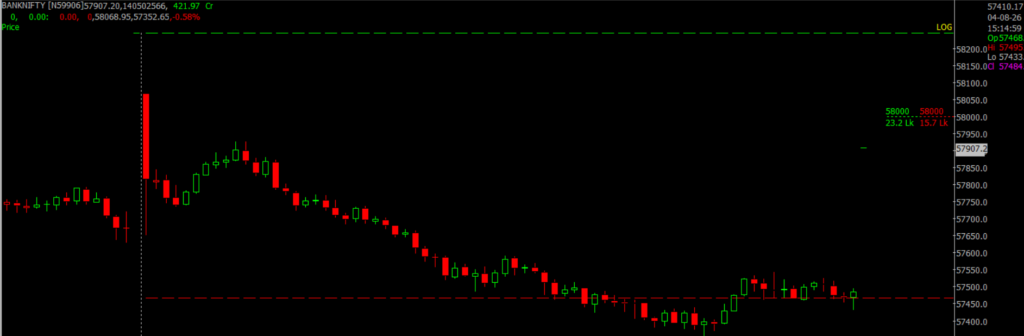
Prediction For Wednesday BANKNIFTY can go up if it goes above 58,000 or down after the level of 57,500, but it also depends upon the Global cues.
The Bank Nifty opened with a gap-down and remained under pressure throughout the trading session, witnessing a gradual decline. However, a sharp recovery during the Closing Auction Session (CAS), with the settlement price coming in more than 400 points above the 3:15 PM closing level, helped pare losses significantly. The index eventually settled at 57,907, down 0.58% for the day. On the daily chart, Bank Nifty formed a small-bodied candle with a long lower shadow, indicating buying interest emerging at lower levels. Technically, the index continues to trade above its short-term and long-term moving averages, reflecting an underlying positive trend. However, momentum indicators and oscillators continue to signal a sideways bias, suggesting the absence of strong directional conviction in the near term. As long as the index holds above the 57,500–57,000 support zone, the broader trend remains constructive, while 58,000–58,500 is likely to act as the immediate resistance zone.
| Highest Call Writing at | 58,000 (23.2 Lk) |
| Highest Put Writing at | 57,500 (15.7 Lk) |
Bank Nifty Support and Resistance
| Support | 57,500–57,000 |
| Resistance | 58,000 and 58,500 |
Voice Of Traders by Spider Software
He Lost ₹45L… Then Built the 1-Min ‘Elephant Candle’ Strategy (Setup Revealed)… (Full Strategy Explained)

Disclaimer: The information provided in this Blog is for educational purposes only and should not be construed as financial advice. Trading in the stock market involves a significant level of risk and can result in both profits and losses. Spider Software & Team does not guarantee any specific outcome or profit from the use of the information provided in this Blog. It is the sole responsibility of the viewer to evaluate their own financial situation and to make their own decisions regarding any investments or trading strategies based on their individual financial goals, risk tolerance, and investment objectives. Spider Software & Team shall not be liable for any loss or damage, including without limitation any indirect, special, incidental or consequential loss or damage, arising from or in connection with the use of this blog or any information contained herein.