
In the Stock Market Today, Sensex rose by 260 points, with the Nifty surpassing 22,000. Both BSE MidCap and SmallCap up by 0.8%.
Stock Market Nifty Chart Prediction.
On May 08, Sensex & Nifty 50 bounced back, ending in the green zone. The Sensex concluded the session at 72,664.47, up by 260 points, while the Nifty 50 finished at 22,055.20, marking 98 points.
Top Nifty gainers: BPCL, Vijaya Diagnostics, Tata Motors, Abbott India and PAYTM
Top Nifty Losers: CIPLA, TFL, JGCHEM, EXCEL, MUTHOOTCAP, BAJAJCON and SULA
Nifty Metal spearheaded the upward movement, surging by 1.5%, while FMCG, Auto, and Pharma sectors followed suit, each gaining 1%. Conversely, Nifty IT recorded the most significant decline, dropping by 0.8%, trailed by Nifty Realty and Nifty PSU Bank, which both experienced losses of 0.4% and 0.3%, respectively.
BSE MidCap and SmallCap indices increased by 0.8%.
Stock Prediction for 13th May 2024.
| STOCK | Good Above | Weak Below |
| BATAINDIA | 1314 | 1296 |
| LT | 3285 | 3250 |
| MFSL | 984 | 970 |
| HAL | 3880 | 3844 |
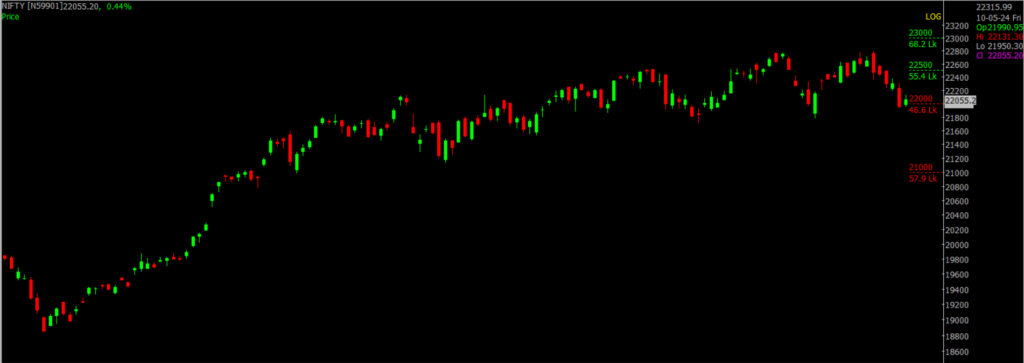
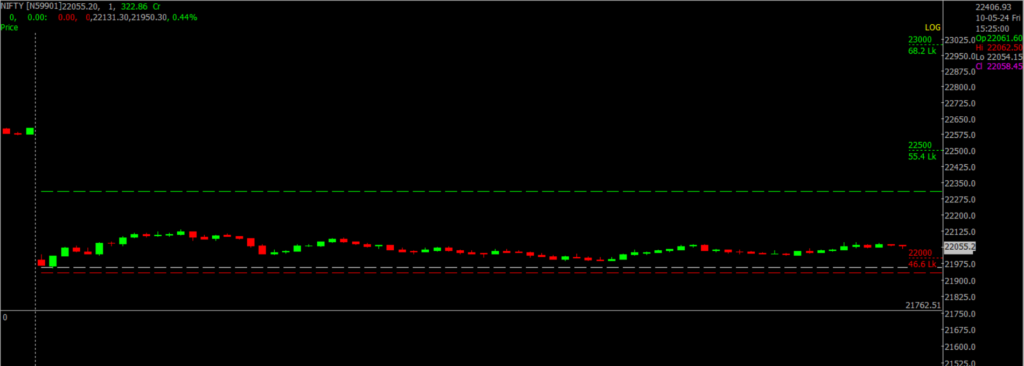
Prediction For Friday, NIFTY can go up if it goes above 22,300 or down after the level of 21,800 but all depends upon the Global cues.
Nifty remained confined within a tight range and eventually closed at 22055. The index exhibited an inside bar candlestick pattern. Therefore, if it maintains yesterday’s low of 21,932, a rebound might occur, although it’s advisable to consider profit-taking. Looking ahead, 21,800-21,500 is anticipated to serve as crucial support, while 22,300-22,500 is identified as significant resistance.
| Highest Call Writing at | 22,300 (55.4 Lakhs) |
| Highest Put Writing at | 21,800 (46.6 Lakhs) |
Nifty Support and Resistance
| Support | 21,800, 21,500 |
| Resistance | 22,300, 22,500 |
Bank Nifty Daily Chart Prediction.
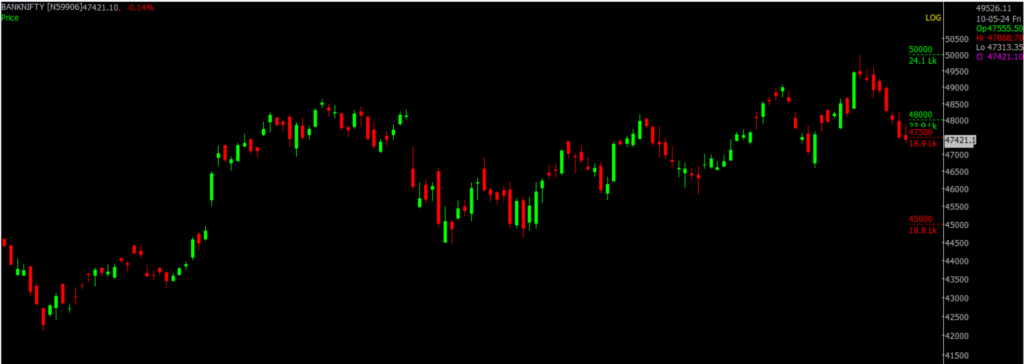
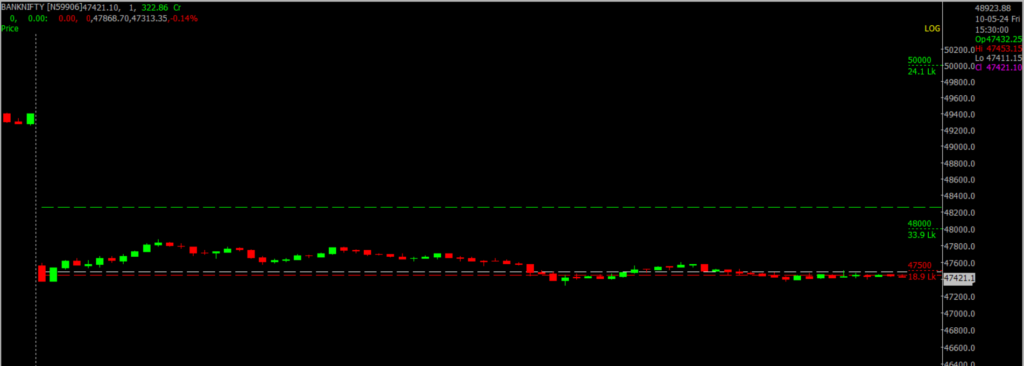
Prediction For Friday, Bank NIFTY can go up if it goes above 48,000 or down after the level of 47,500 but it all depends upon the Global cues.
Bank Nifty started positively, hitting 47,868, but ended flat to negative at 47,421 amid strong selling pressure. Last week’s shooting star candlestick was followed by a bearish engulfing this week, signaling weakness. If the index stays below 48,000, weakness may persist. Key support lies around 47,500-47,000, with resistance at 48,000-48,500.
| Highest Call Writing at | 48,000 (33.9 Lakhs) |
| Highest Put Writing at | 47,500 (18.9 Lakhs) |
Bank Nifty Support and Resistance
| Support | 47,500, 47,000 |
| Resistance | 48,000, 48,500 |
Click here to learn the Stocks to Watch as Tensions Between Israel and Iran Escalates.
New Options Trading Software by Spider is here, Try GChart demo for free. Register Now
If you’d like to know how we analyze the market and provide accurate levels every day. then click on the Free Demo button below and change your trading life for good. 5X returns are possible in options trading If you have Spider Software in your trading system.
Disclaimer: The information provided in this Blog is for educational purposes only and should not be construed as financial advice. Trading in the stock market involves a significant level of risk and can result in both profits and losses. Spider Software & Team does not guarantee any specific outcome or profit from the use of the information provided in this Blog. It is the sole responsibility of the viewer to evaluate their own financial situation and to make their own decisions regarding any investments or trading strategies based on their individual financial goals, risk tolerance, and investment objectives. Spider Software & Team shall not be liable for any loss or damage, including without limitation any indirect, special, incidental or consequential loss or damage, arising from or in connection with the use of this blog or any information contained herein. ![]()