In today’s blog, let’s take a look at 7 Strong Candlestick Patterns That Signal a Continuation of the Trend.
Continuation candlestick patterns suggest that after a short break or pause, the current trend is likely to keep going. Traders use these patterns in technical analysis to predict when a trend will resume. Unlike reversal patterns, which signal a potential trend change, continuation patterns help traders spot good entry and exit points during a trend.
5 Strong Candlestick Patterns for Trend Continuation
1. Doji
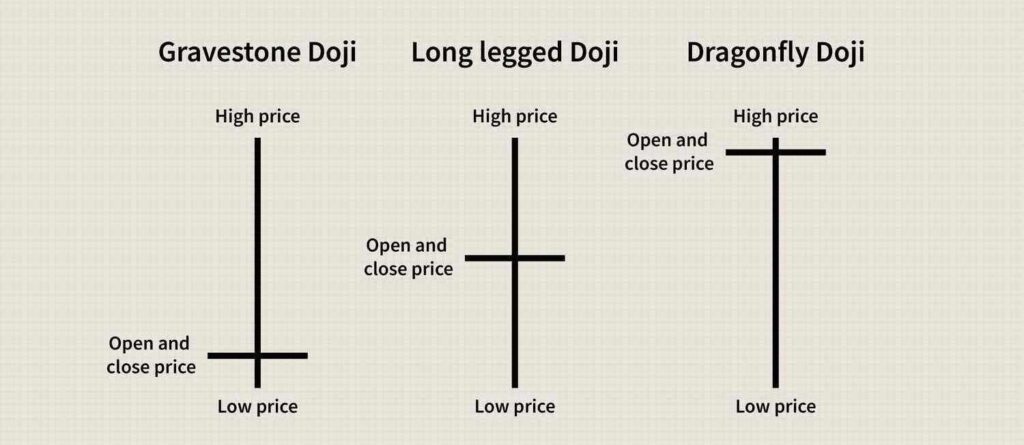
A Doji candlestick pattern has a small body, where the open and close prices are very close to each other. It shows indecision between buyers and sellers in the market. When a Doji appears during a trend, it can indicate a temporary pause or consolidation, suggesting that if the trend is confirmed, it may continue.
2. Spinning Top
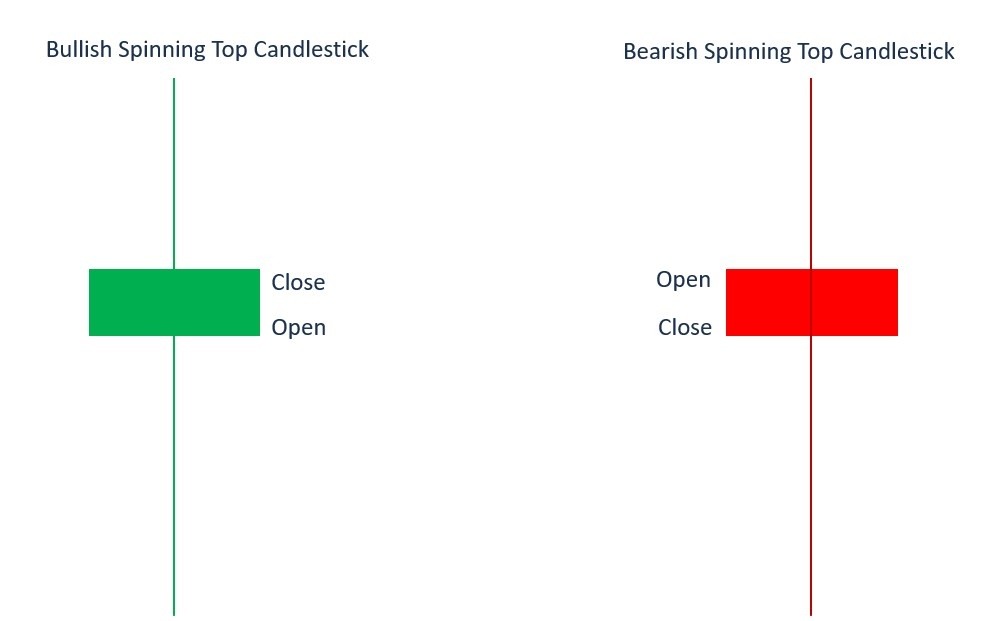
The Spinning Top pattern has a small body with long upper and lower shadows, showing indecision and a balance between buyers and sellers. If the next candle confirms the trend’s direction, a Spinning Top may suggest that the trend could continue.
3. Rising & Falling Three Methods
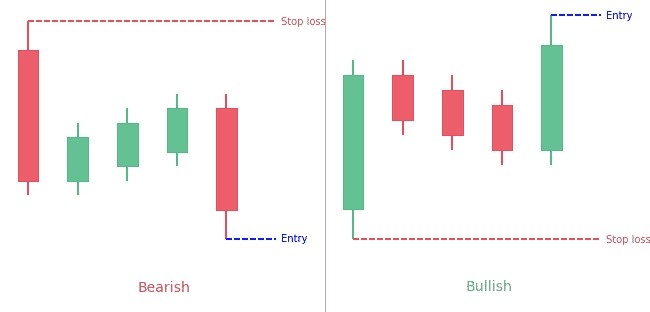
These patterns consist of a series of candlesticks that signal a consolidation phase within the dominant trend:
- Rising Three Methods: In an uptrend, this pattern features three small bullish candles or Dojis followed by a large bullish candle. It indicates a brief consolidation before the uptrend resumes.
- Falling Three Methods: In a downtrend, this pattern shows three small bearish candles followed by a large bearish candle. It suggests a temporary pause in the downtrend before it continues.
4. Tasuki Gap
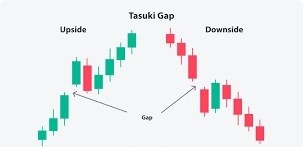
The Tasuki Gap is a continuation pattern formed by three candles within a trend:
- In an uptrend, a bearish candle creates a gap down after a bullish candle. The third candle is bullish and closes within the gap, suggesting that the uptrend may continue.
- In a downtrend, a bullish candle creates a gap up after a bearish candle. The third candle is bearish and closes within the gap, indicating that the downtrend is likely to resume.’
5. Mat-Hold
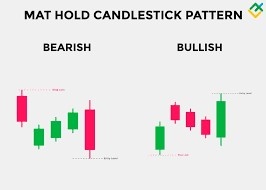
The Mat-Hold pattern is a continuation pattern in an uptrend, starting with a long bullish candle. This is followed by a small candle, often a Doji, indicating a brief pullback or consolidation. The pattern ends with another long bullish candle, suggesting that the uptrend is likely to continue after the short pause.
Power of Algorithms in Options Trading, Try Spider Now: Register Now
If you’d like to know how we analyze the market and provide accurate levels every day. then click on the Free Demo button below and change your trading life for good. 5X returns are possible in options trading If you have Spider Software in your trading system.
Disclaimer: The information provided in this Blog is for educational purposes only and should not be construed as financial advice. Trading in the stock market involves a significant level of risk and can result in both profits and losses. Spider Software & Team does not guarantee any specific outcome or profit from the use of the information provided in this Blog. It is the sole responsibility of the viewer to evaluate their own financial situation and to make their own decisions regarding any investments or trading strategies based on their individual financial goals, risk tolerance, and investment objectives. Spider Software & Team shall not be liable for any loss or damage, including without limitation any indirect, special, incidental or consequential loss or damage, arising from or in connection with the use of this blog or any information contained herein. ![]()