A bullish breakout pattern where a short-term moving average crosses above a long-term moving average, signaling upward momentum.

A golden cross happens when a short-term moving average (like the 50-day average) crosses above a long-term moving average (like the 200-day average). This is a signal that the price could rise, suggesting a potential long-term uptrend. Traders view it as a bullish signal, and higher trading volumes enhance its reliability.
Understanding Golden Crossover
A Golden Crossover is a technical analysis tool that signals momentum, indicating that prices are rising and gaining strength. It suggests that traders and investors have shifted their outlook from bearish to bullish.
The indicator typically unfolds in three stages:
Stage 1: A downtrend reaches its lowest point, with buyers starting to outweigh sellers.
Stage 2: The shorter moving average crosses above the longer moving average, signaling a breakout and confirming the reversal of the downtrend.
Stage 3: The uptrend continues after the crossover, with the moving averages providing support during pullbacks until they potentially cross back down.
Moving Averages Used with Golden Crossover
Traders commonly use the 50-day and 200-day moving averages to spot a golden cross. Longer time frames often lead to stronger and more lasting breakouts.
Day traders often use shorter periods, like the 5-day or 15-day moving averages, to spot golden cross breakouts within the day. Some traders may choose other time frames, like weeks or months, based on their preferences.
However, it’s important to remember that the longer the time frame, the more reliable and lasting the breakout tends to be.
EXAMPLE
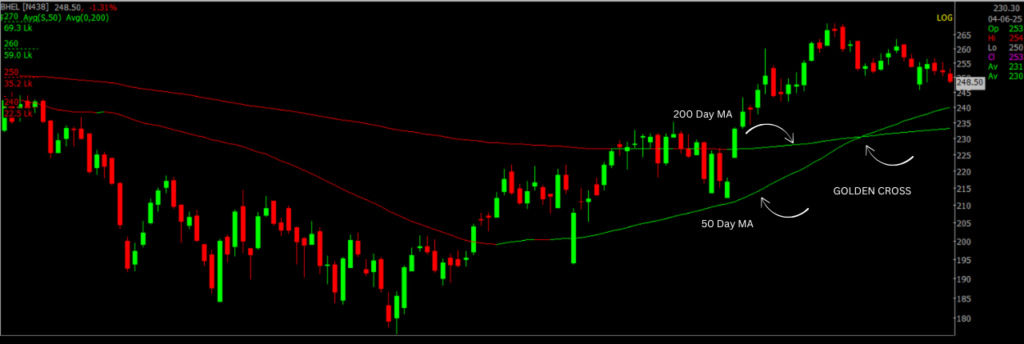
Let’s take the example of BHEL stock, which recently formed a classic Golden Crossover pattern on the chart. On 20th March 2025, the 50-Day Moving Average (green line) crossed above the 200-Day Moving Average (red line), signaling a potential shift from a bearish to a bullish trend. Traders widely track this technical formation, known as a Golden Crossover, as a strong bullish indicator.
Following this crossover, BHEL’s stock price exhibited consistent upward movement, progressively climbing from around ₹220 to ₹265 in the subsequent sessions. The 50-day MA started acting as a dynamic support, helping the price sustain its upward momentum. Moving averages, especially the 50 and 200-day lines, are valuable tools for identifying trend changes, and in this case, BHEL’s chart serves as a textbook example of how powerful and actionable the golden crossover signal can be when supported by strong price action.
Limitations of a Golden Crossover
All indicators are lagging, meaning they are based on past data and reflect what has already happened. Because of this, they are reactive, not proactive, and can’t predict future movements. A golden cross, while often seen as a sign of a bull market, can sometimes give false signals.
Even though it has been accurate in predicting past bull markets, golden crosses don’t always work. So, it’s important to use other signals, especially leading indicators, to confirm a golden cross before acting on it.
Join our exclusive one-day seminar for serious traders ready to level up. Whether you’re into intraday, options, or algo trading, gain the edge, discipline, and mastery to excel in the markets. Register Now
If you’d like to know how we analyze the market and provide accurate levels every day. then click on the Free Demo button below and change your trading life for good. 5X returns are possible in options trading If you have Spider Software in your trading system.
Power of Algorithms in Options Trading, Try Spider Now: Register Now
Disclaimer: The information provided in this Blog is for educational purposes only and should not be construed as financial advice. Trading in the stock market involves a significant level of risk and can result in both profits and losses. Spider Software & Team does not guarantee any specific outcome or profit from the use of the information provided in this Blog. It is the sole responsibility of the viewer to evaluate their own financial situation and to make their own decisions regarding any investments or trading strategies based on their individual financial goals, risk tolerance, and investment objectives. Spider Software & Team shall not be liable for any loss or damage, including without limitation any indirect, special, incidental or consequential loss or damage, arising from or in connection with the use of this blog or any information contained herein. ![]()