
In today’s stock market, stock markets bounced back strongly. The Nifty crossed 24,000, and the Sensex jumped by 919 points.
Stock Market Nifty Chart Prediction
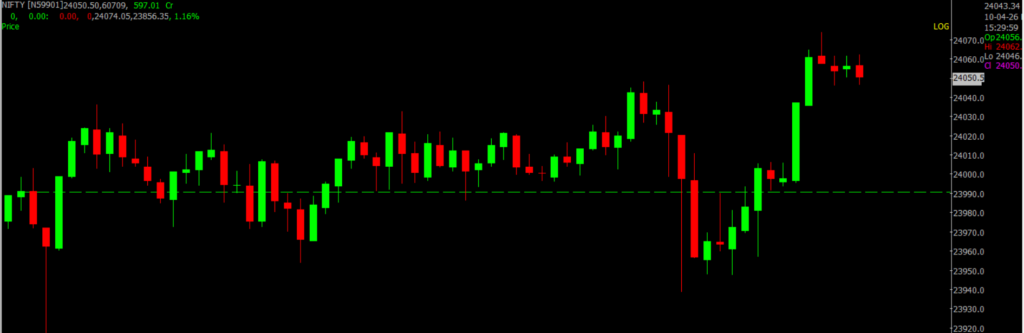
On April 10, Sensex was up 918.60 points at 77,550.25, and the Nifty was up 275.50 points at 24,050.60. About 3245 shares advanced, 889 shares declined, and 126 shares remained unchanged.
Top Nifty gainers: Asian Paints, Eicher Motors, ICICI Bank, Bajaj Auto, Shriram Finance
Top Nifty Losers : Coal India, Sun Pharma, Infosys, TCS, Tech Mahindra.
Among sectors, Auto, Capital Goods, Consumer Durables, Realty, Power, FMCG, PSU Bank, Metal, PSU Bank, Private Bank added 1-2%, while IT index shed 1.7%.
Nifty Midcap and Smallcap indices rose 1.5 percent each.
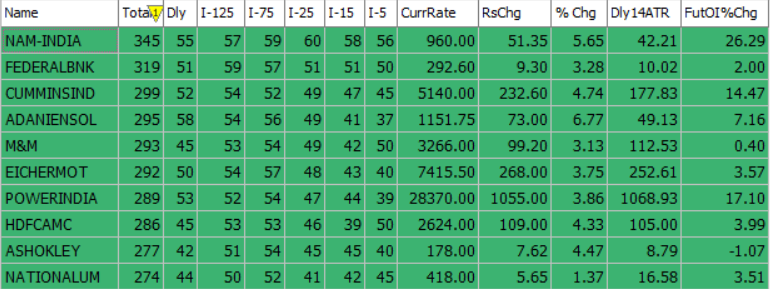
Best Stocks of the day according to AI (Delta Dash)
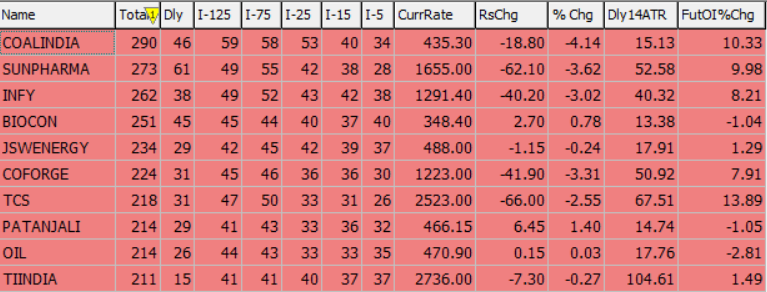
Worst Stocks of the day according to AI (Delta Dash)
Stock Prediction for 13th April 2026
| STOCK | Good Above | Weak Below |
| ASTRAL | 1632 | 1616 |
| CHOLAFIN | 1588 | 1572 |
| POWERGRID | 303 | 301 |
| WAAREEENER | 3300 | 3265 |
Prediction for Monday NIFTY can go up if it goes above 24,000 or down after the level of 23,600, but it also depends upon the Global cues.
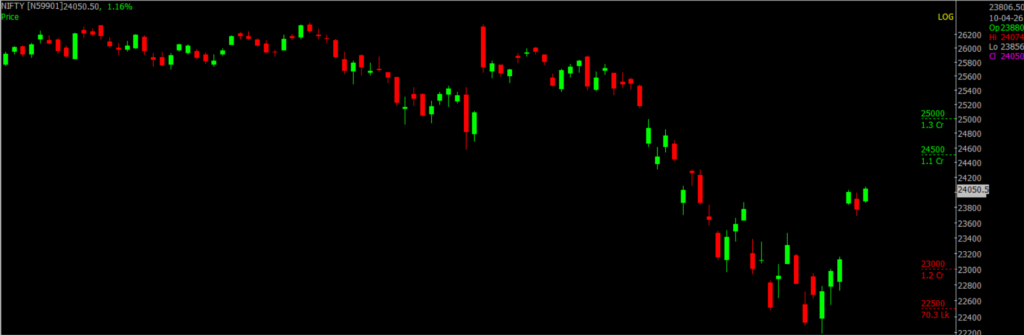
The Nifty continued to trade in positive territory, supported by easing crude oil prices and growing expectations of a confirmed truce agreement. On the hourly chart, the index has been consistently moving above the 200 SMA, indicating a strengthening bullish trend.
On the daily chart, the RSI has given a bullish crossover and is trending upward, reflecting increasing momentum. In the near term, the outlook remains positive. However, if a concrete truce deal is not finalized by the weekend, the market could witness some negative reaction.
Immediate resistance is placed in the 24,000–24,400 zone, while support lies in the 23,700–23,200 range.
| Highest Call Writing at | 24,000 (1.3 cr) |
| Highest Put Writing at | 23,700 (67.1 Lk) |
Nifty Support and Resistance
| Support | 23,700–23,200 |
| Resistance | 24,000–24,400 |
Bank Nifty Daily Chart Prediction
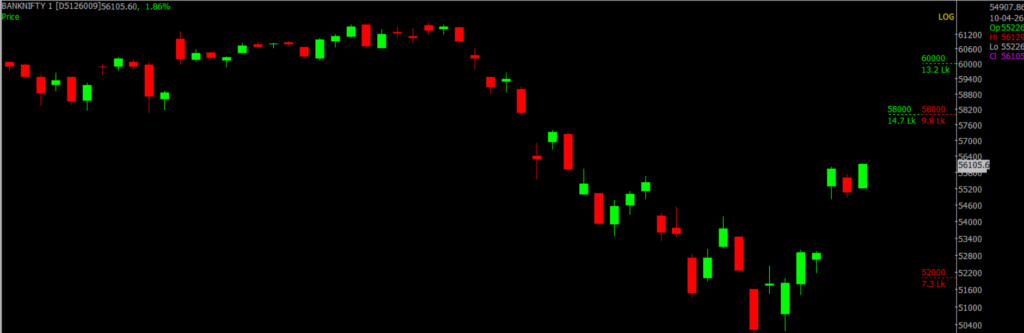
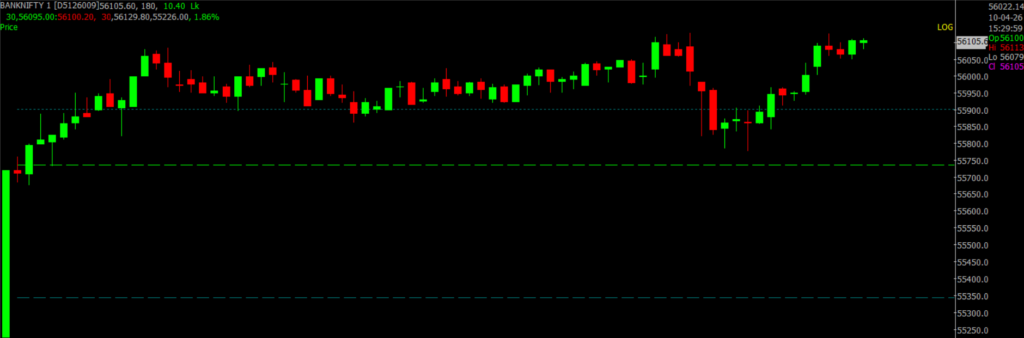
Prediction For Monday BANKNIFTY can go up if it goes above 55,900 or down after the level of 55,200, but it also depends upon the Global cues.
Bank Nifty is showing positive signs. A strong bullish pattern on the weekly chart suggests improving market sentiment. On the daily chart, the index is trading near its 200-day average, which indicates a recovery phase but not a confirmed breakout yet.
Momentum indicators are turning positive, supporting a short-term upward trend.
The index may move towards the 50-day average near 57,000. Immediate resistance is around 56,200, while support is near 55,300, which could help limit any downside. Overall, resistance lies between 55,900–56,400, and support is in the range of 55,200–54,600.
| Highest Call Writing at | 55,900 (14.7 Lk) |
| Highest Put Writing at | 55,200 (9.8 Lk) |
Bank Nifty Support and Resistance
| Support | 55,200–54,600 |
| Resistance | 55,900–56,400 |
Voice Of Traders by Spider Software
He Lost ₹45L… Then Built the 1-Min ‘Elephant Candle’ Strategy (Setup Revealed)… (Full Strategy Explained)

Disclaimer: The information provided in this Blog is for educational purposes only and should not be construed as financial advice. Trading in the stock market involves a significant level of risk and can result in both profits and losses. Spider Software & Team does not guarantee any specific outcome or profit from the use of the information provided in this Blog. It is the sole responsibility of the viewer to evaluate their own financial situation and to make their own decisions regarding any investments or trading strategies based on their individual financial goals, risk tolerance, and investment objectives. Spider Software & Team shall not be liable for any loss or damage, including without limitation any indirect, special, incidental or consequential loss or damage, arising from or in connection with the use of this blog or any information contained herein. ![]()