
In today’s stock market, Markets end lower after a volatile session; Nifty slips below 25,750, Sensex falls 270 points.
Stock Market Nifty Chart Prediction

On Jan 13, Sensex was down 250.48 points at 83,627.69, and the Nifty was down 57.95 points at 25,732.30. About 1,870 shares advanced, 1,942 shares declined, and 158 shares remained unchanged.
Top Nifty gainers: ONGC, Tech Mahindra, Eternal, ICICI Bank, Hindalco Industries.
Top Nifty Losers : Trent, L&T, Dr Reddy’s Labs, Reliance Industries and Interglobe Aviation
On the sectoral front, IT, media, PSU Bank, metal ended in the green, while FMCG, capital goods, consumer durables, pharma, realty fell between 0.3-0.5 percent.
BSE Midcap index shed 0.2%, while smallcap index rose 0.5%.
Best Stocks of the day according to AI (Delta Dash)
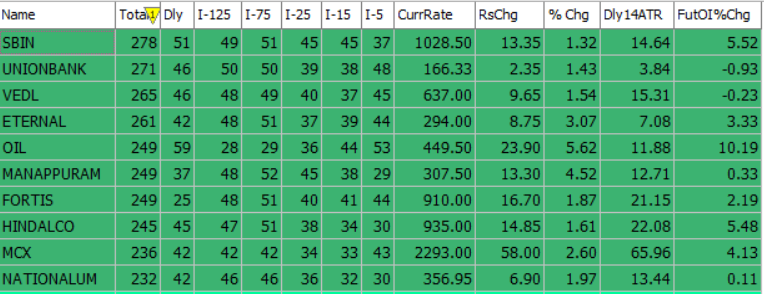
Worst Stocks of the day according to AI (Delta Dash)

Stock Prediction for 14th January 2026
| STOCK | Good Above | Weak Below |
| ANGELONE | 2450 | 2425 |
| DALBHARAT | 2116 | 2092 |
| ICICIBANK | 1444 | 1428 |
| TCS | 3278 | 3246 |
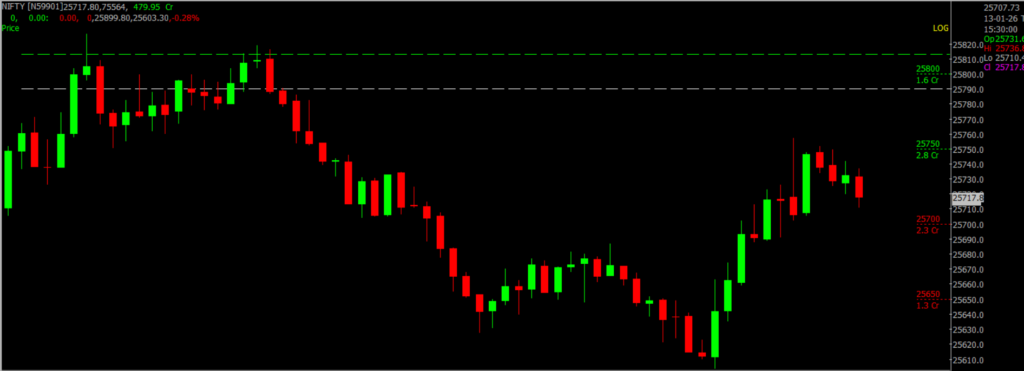
Prediction for Tuesday NIFTY can go up if it goes above 25,800 or down after the level of 25,700, but it also depends upon the Global cues.
NIFTY (25,732): NIFTY remains in a negative trend. Traders holding short positions may continue to hold with a daily closing stop-loss at 25,851. Fresh long positions can be considered only if NIFTY closes above the 25,851 level. On the technical front, resistance is placed in the 25,800–26,200 zone, while support is seen between 25,700 and 25,200.
| Highest Call Writing at | 25,800 (1.6 Cr) |
| Highest Put Writing at | 25,700 (1.3 Cr) |
Nifty Support and Resistance
| Support | 25,700 and 25,200 |
| Resistance | 25,800–26,200 |
Bank Nifty Daily Chart Prediction
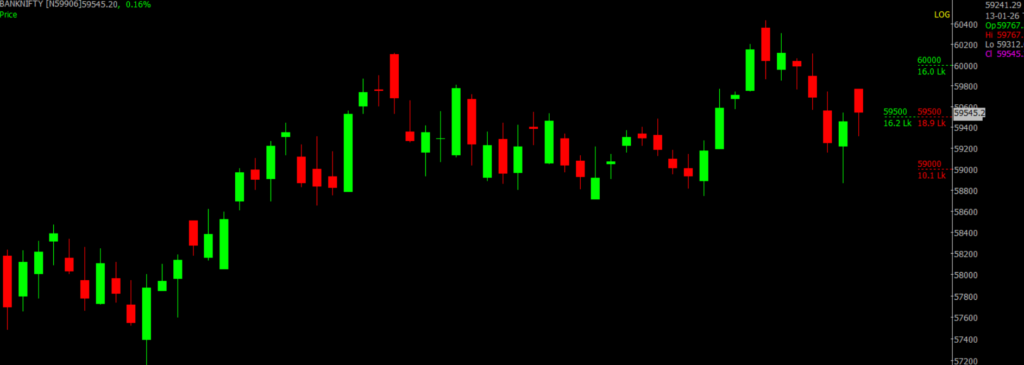
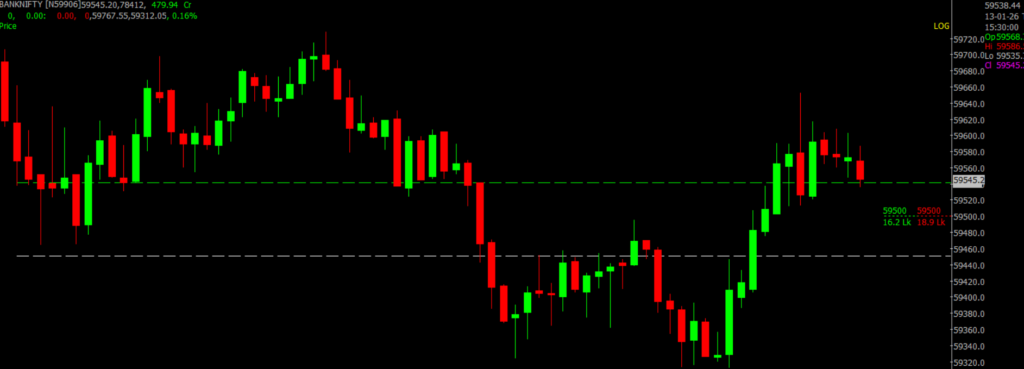
Prediction For Tuesday BANKNIFTY can go up if it goes above 59,700 or down after the level of 59,300, but it also depends upon the Global cues.
On the daily chart, the Nifty Bank index is trading above its falling trendline support and above the 20-day and 50-day SMAs, indicating an improving technical structure. The hourly RSI has shown a bullish crossover, while the daily RSI is yet to confirm, pointing to cautious optimism.
The 20-day SMA is acting as a strong support zone. Immediate support is placed at 59,300, with resistance at 59,800, while positional support is seen at 59,000. If the index sustains above the 20-day SMA for the next 2–3 sessions, a move toward 60,200 is likely. On the technical front, resistance is placed in the 59,700–60,000 zone, while support is seen between 59,300 and 58,700.
| Highest Call Writing at | 59,700 (16.2 Lk) |
| Highest Put Writing at | 59,300 (10.1 Lk) |
Bank Nifty Support and Resistance
| Support | 59,300 and 58,700 |
| Resistance | 59,700–60,000 |
Voice Of Traders by Spider Software
HDFC Securities’ SECRET Stock Picking Formula! (STRATEGY REVEALED)

Disclaimer: The information provided in this Blog is for educational purposes only and should not be construed as financial advice. Trading in the stock market involves a significant level of risk and can result in both profits and losses. Spider Software & Team does not guarantee any specific outcome or profit from the use of the information provided in this Blog. It is the sole responsibility of the viewer to evaluate their own financial situation and to make their own decisions regarding any investments or trading strategies based on their individual financial goals, risk tolerance, and investment objectives. Spider Software & Team shall not be liable for any loss or damage, including without limitation any indirect, special, incidental or consequential loss or damage, arising from or in connection with the use of this blog or any information contained herein. ![]()