
In today’s stock market, Markets stage a robust comeback in strong rally: Nifty climbs past 22,900, Sensex jumps 1,372 points higher.
Stock Market Nifty Chart Prediction
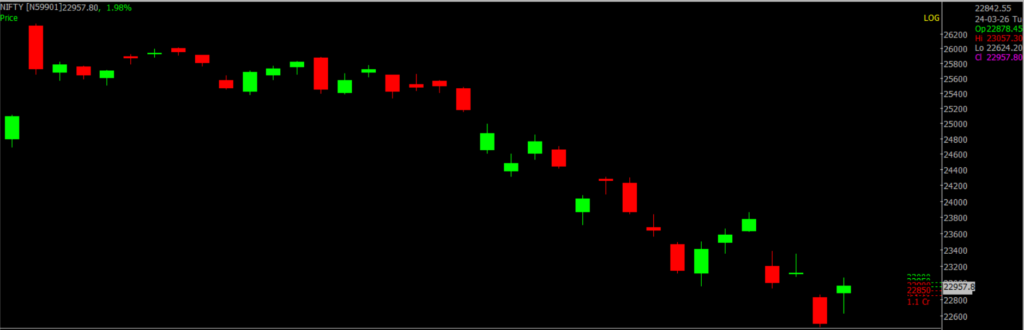
On March 24, Sensex was up 1,372.06 points at 74,068.45, and the Nifty was up 445.15 points at 22,957.80. About 2,843 shares advanced, 1,257 shares declined, and 152 shares remained unchanged.
Top Nifty gainers: L&T, Interglobe Aviation, Asian Paints, Eternal and Bajaj Finance
Top Nifty Losers : Coal India, Adani Enterprises, Sun Pharma, Cipla and Power Grid Corp.
All the sectoral indices ended in the green with auto, IT, metal, media, bank, consumer durables, PSU Bank, Private bank, infra, consumer durables up 2% each.
Nifty Midcap and smallcap indices added 2.6 percent each.
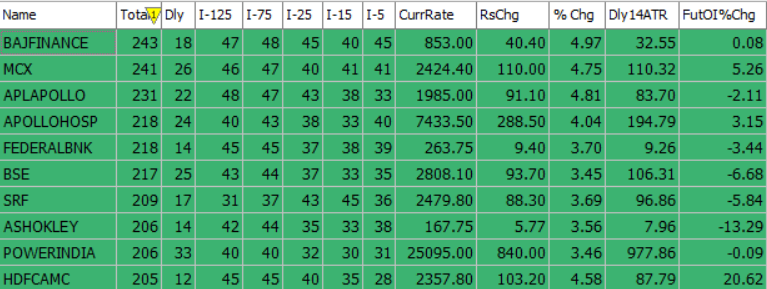
Best Stocks of the day according to AI (Delta Dash)
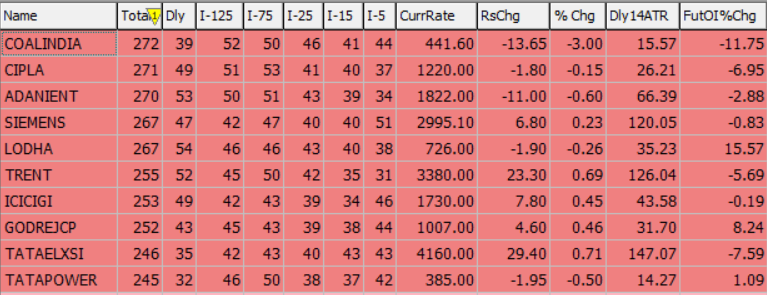
Worst Stocks of the day according to AI (Delta Dash)
Stock Prediction for 25th March 2026
| STOCK | Good Above | Weak Below |
| ICICIBANK | 1260 | 1248 |
| LAURUSLABS | 1000 | 988 |
| LT | 3540 | 3505 |
| TVSMOTOR | 3505 | 3470 |
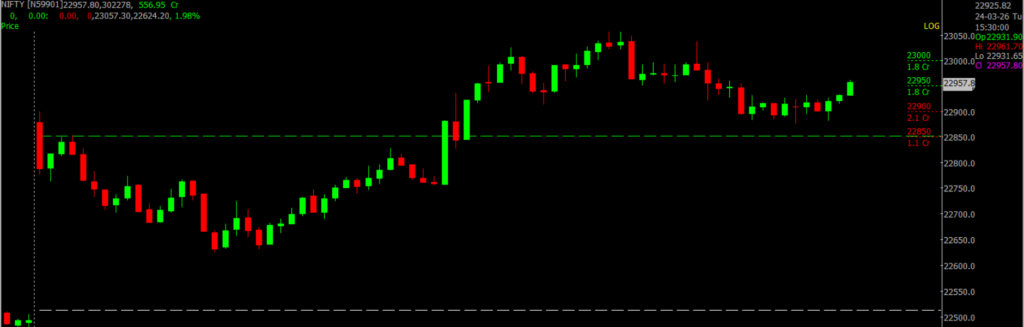
Prediction for Wednesday NIFTY can go up if it goes above 22,900 or down after the level of 22,800, but it also depends upon the Global cues.
The Nifty opened on a strong note following early comments hinting at a possible de-escalation of the Middle East conflict. The index saw a sharp rally but faced resistance near the 23,000 mark, where call writers held significant positions.
Technically, Nifty closed with an indecisive candle, suggesting uncertainty about the next directional move. The near-term trend is likely to hinge on Wednesday’s opening a weak start could trigger bearish sentiment, while a firm opening may support short-term positivity. Resistance is placed in the 22,900–23,200 zone, while support is seen between 22,800–22,500.
| Highest Call Writing at | 22,900 (1.8 cr) |
| Highest Put Writing at | 22,800 (1.1 cr) |
Nifty Support and Resistance
| Support | 22,800–22,500 |
| Resistance | 22,900–23,200 |
Bank Nifty Daily Chart Prediction
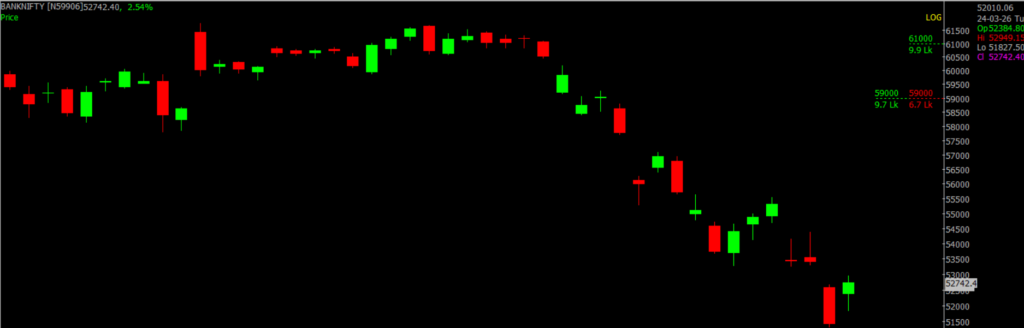
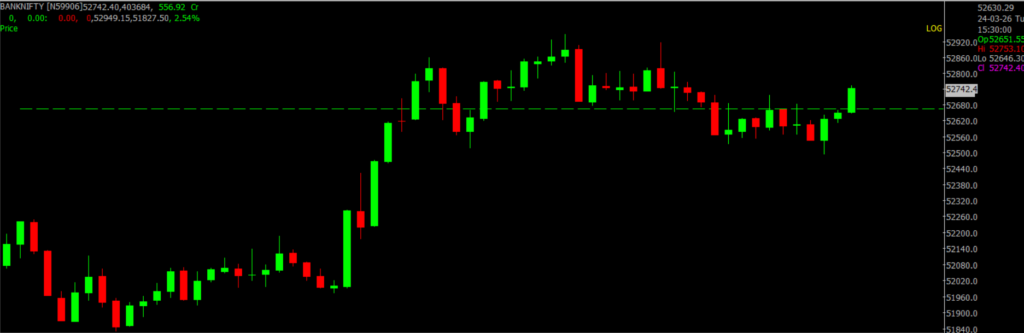
Prediction For Wednesday BANKNIFTY can go up if it goes above 52,800 or down after the level of 52,500, but it also depends upon the Global cues.
Bank Nifty ended the session on a positive note and is currently positioned in an oversold zone across multiple timeframes. On the daily chart, a positive divergence is visible, with the RSI nearing a bullish crossover.
This setup indicates a potential pullback towards its short-term average, with the 10-day SMA placed near 54,000 levels. The immediate target is seen at 53,000; a sustained move above this level could push the index towards 54,000, while key support is positioned at 51,500. Resistance is seen in the 52,800–53,500 range, while support lies between 52,500–52,000.
| Highest Call Writing at | 52,800 (9.9 Lk) |
| Highest Put Writing at | 52,500 (6.7 Lk) |
Bank Nifty Support and Resistance
| Support | 52,500–52,000 |
| Resistance | 52,800–53,500 |
Voice Of Traders by Spider Software
He Lost ₹45L… Then Built the 1-Min ‘Elephant Candle’ Strategy (Setup Revealed)… (Full Strategy Explained)

Disclaimer: The information provided in this Blog is for educational purposes only and should not be construed as financial advice. Trading in the stock market involves a significant level of risk and can result in both profits and losses. Spider Software & Team does not guarantee any specific outcome or profit from the use of the information provided in this Blog. It is the sole responsibility of the viewer to evaluate their own financial situation and to make their own decisions regarding any investments or trading strategies based on their individual financial goals, risk tolerance, and investment objectives. Spider Software & Team shall not be liable for any loss or damage, including without limitation any indirect, special, incidental or consequential loss or damage, arising from or in connection with the use of this blog or any information contained herein. ![]()