
In today’s stock market, Bears dominated Dalal Street as the Sensex fell 733 points and the Nifty slipped below 24,700.
Stock Market Nifty Chart Prediction
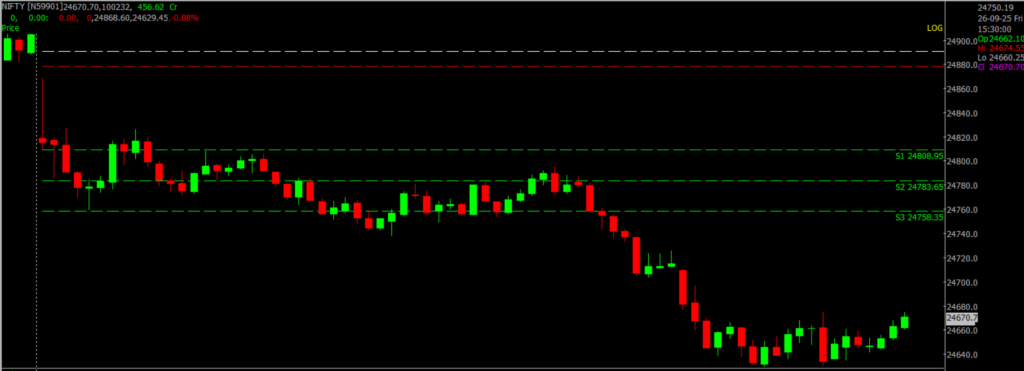
On September 26, the Sensex was down 733.22 points at 80,426.46, and the Nifty was down 236.15 points at 24,654.70. About 912 shares advanced, -2828 shares declined, and 106 shares unchanged.
Top Nifty gainers: L&T, Tata Motors, Eicher Motors, Reliance Industries, ITC
Top Nifty Losers : IndusInd Bank, Sun Pharma, M&M, Eternal, Tata Steel.
All sectoral indices closed lower, with PSU Bank, banking, capital goods, consumer durables, metals, IT, telecom, and pharma sectors slipping 1–2 percent.
BSE midcap and smallcap indices shed 2% each.
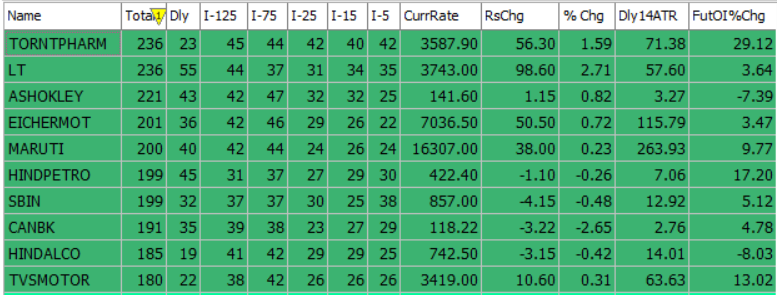
Best Stocks of the day according to AI (Delta Dash)
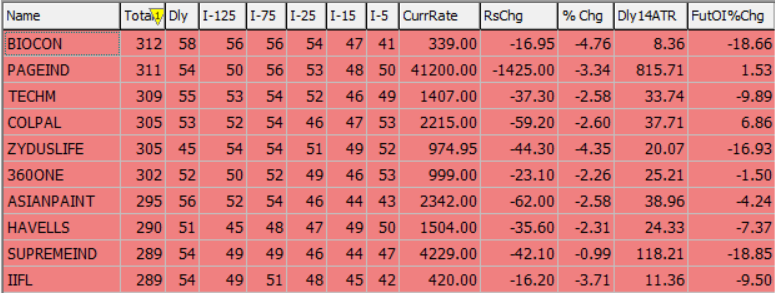
Worst Stocks of the day according to AI (Delta Dash)
Stock Prediction for 29th September 2025
| STOCK | Good Above | Weak Below |
| HINDALCO | 746 | 738 |
| ICICIGI | 1892 | 1872 |
| ITC | 407 | 403 |
| TORNTPHARM | 3605 | 3570 |
Prediction for Monday NIFTY can go up if it goes above 25,000 or down after the level of 24,600, but it also depends upon the Global cues.
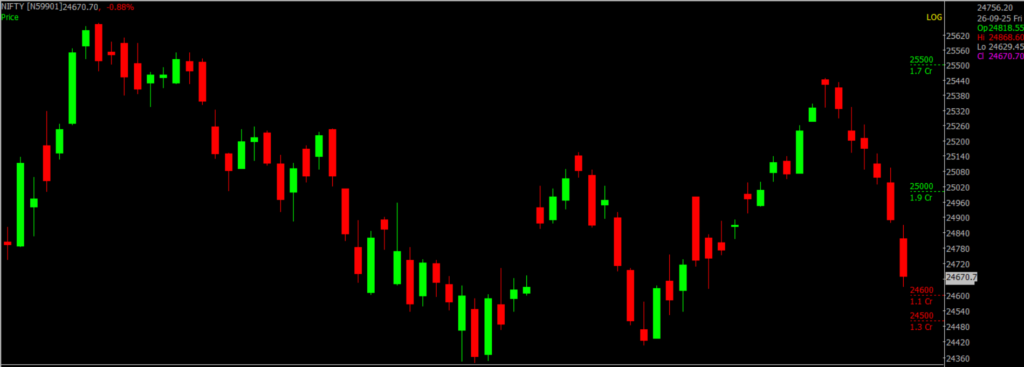
Indian benchmark indices opened with a sharp gap-down, continued to slide through the day, and closed lower, signaling persistent selling pressure and cautious market sentiment. Nifty ended the session at 24,655, down 0.95%, after extending losses intraday. The daily chart shows a large bearish candle, highlighting strong dominance of sellers over buyers. On the weekly timeframe, Nifty formed a notable bearish candle, breaking its three-week winning streak. Resistance is placed around 25,000 and 25,500, while key support levels lie near 24,600 and 24,000.
| Highest Call Writing at | 25,000 (1.9 Cr) |
| Highest Put Writing at | 24,600 (1.1 Cr) |
Nifty Support and Resistance
| Support | 24,600 and 24,000 |
| Resistance | 25,000 and 25,500 |
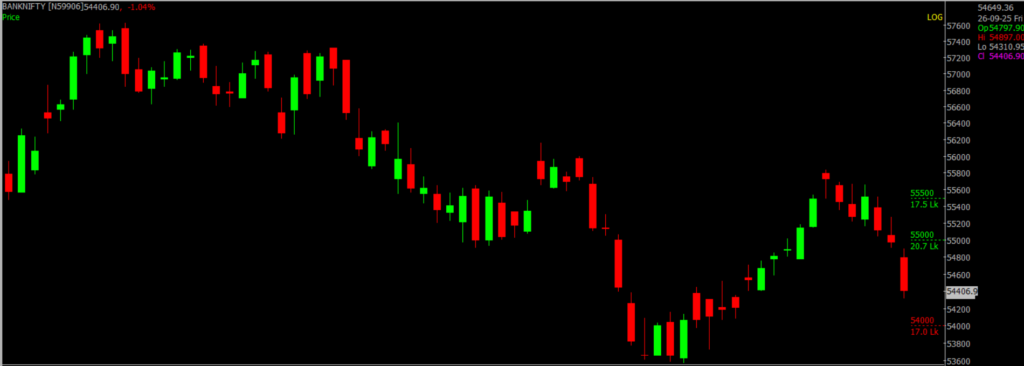
Bank Nifty Daily Chart Prediction
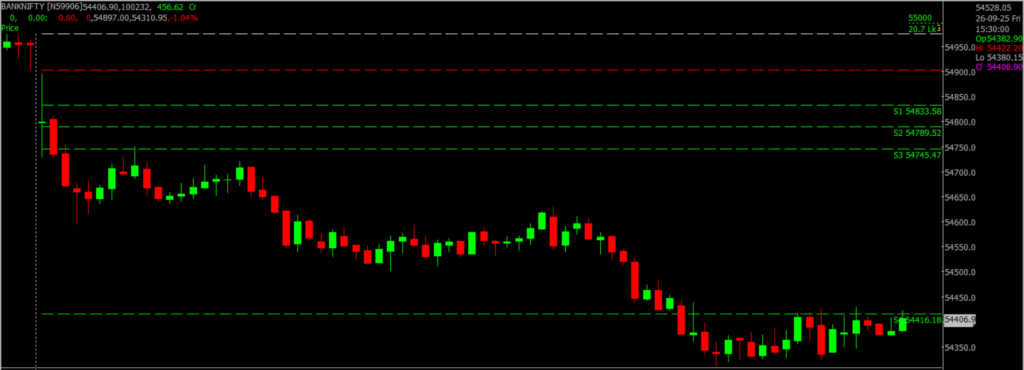
Prediction For Monday BANKNIFTY can go up if it goes above 55,000 or down after the level of 54,000, but it also depends upon the Global cues.
Bank Nifty opened weak and moved in a narrow range before breaking lower, ending the session at 54,389, down 1.22%. On the daily chart, it slipped below the 100-day EMA of 54,901, marking its third straight day of losses and signaling continued bearish momentum. The index remains in a negative trend. Traders holding short positions can maintain them with a daily closing stop-loss at 55,052. Key resistance levels are placed at 55,000 and 55,500, while support is seen between 54,000 and 53,000.
| Highest Call Writing at | 55,000 (20.7 Lk) |
| Highest Put Writing at | 54,000 (17.0 Lk) |
Bank Nifty Support and Resistance
| Support | 54,000 to 53,000 |
| Resistance | 55,000 and 55,500 |
Power of Algorithms in Options Trading, Try Spider Now: Register Now
If you’d like to know how we analyze the market and provide accurate levels every day. then click on the Free Demo button below and change your trading life for good. 5X returns are possible in options trading If you have Spider Software in your trading system.
Disclaimer: The information provided in this Blog is for educational purposes only and should not be construed as financial advice. Trading in the stock market involves a significant level of risk and can result in both profits and losses. Spider Software & Team does not guarantee any specific outcome or profit from the use of the information provided in this Blog. It is the sole responsibility of the viewer to evaluate their own financial situation and to make their own decisions regarding any investments or trading strategies based on their individual financial goals, risk tolerance, and investment objectives. Spider Software & Team shall not be liable for any loss or damage, including without limitation any indirect, special, incidental or consequential loss or damage, arising from or in connection with the use of this blog or any information contained herein. ![]()