
In today’s stock market, Markets surged on easing tension hopes, with the Sensex rising 1,187 points & Nifty climbing above 22,600.
Stock Market Nifty Chart Prediction

On April 01, the Sensex was up 1,186.77 points at 73,134.32, and the Nifty was up 348 points at 22,679.40. About 3675 shares advanced, 478 shares declined, and 90 shares unchanged.
Top Nifty gainers: nterglobe Aviation, Adani Ports, Adani Enterprises, Trent, Bharat Electronics.
Top Nifty Losers : Dr Reddy’s Labs, HDFC Life, Cipla, NTPC, Sun Pharma.
Except pharma (down 1%), all other sectoral indices ended in the green with defence index surged more than 5%, capital goods, media, PSU Bank indices rose 3% each, while auto, consumer durables, IT, metal, realty, FMCG, telecom, Private Bank up 1-2%.
Broader markets also witnessed sharp declines, with the Nifty Midcap and Smallcap indices shedding around 2.6 percent each.
Nifty Midcap index added 2.2%and smallcap index rose 3.3%.
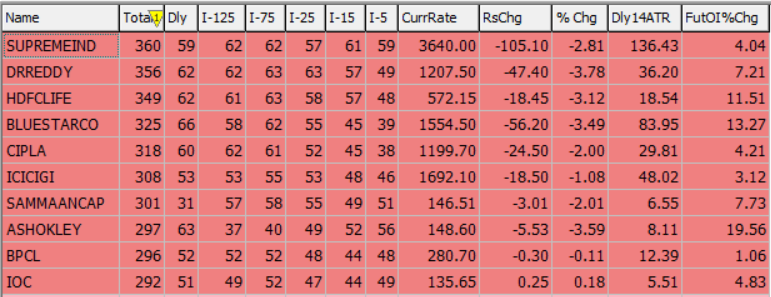
Best Stocks of the day according to AI (Delta Dash)

Worst Stocks of the day according to AI (Delta Dash)
Stock Prediction for 2nd April 2026
| STOCK | Good Above | Weak Below |
| BSE | 2876 | 2846 |
| INDIANB | 890 | 882 |
| PREMIERENE | 936 | 884 |
| TITAN | 4075 | 4035 |
Prediction for Wednesday NIFTY can go up if it goes above 22,500 or down after the level of 22,300, but it also depends upon the Global cues.
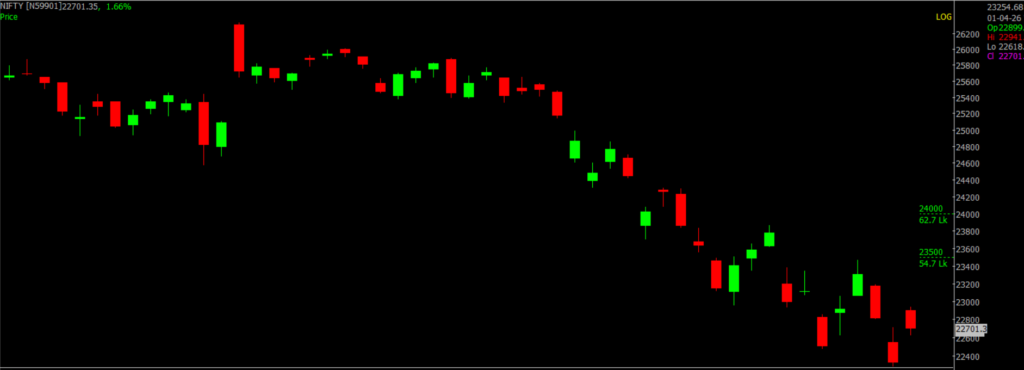
Nifty is showing signs of a mild recovery after a sharp downtrend, but the overall structure still remains weak unless key resistance levels are reclaimed. On the downside, the 21,000–20,500 zone will act as a strong support area; holding above this range can help the index stabilize and attempt a further bounce. However, any breakdown below 20,500 could trigger fresh selling pressure and extend the decline. On the upside, the 23,000–24,000 zone is a crucial resistance band, where selling is likely to emerge. A sustained move above 23,000 may lead to a short-term recovery towards 24,000, but a decisive breakout above 24,000 is required to confirm a trend reversal. Until then, the index is likely to remain volatile with a cautious to bearish bias.
| Highest Call Writing at | 23,000 (62.7 Lk) |
| Highest Put Writing at | 21,000 (60.0 Lk) |
Nifty Support and Resistance
| Support | 21,000–20,500 |
| Resistance | 23,000–24,000 |
Bank Nifty Daily Chart Prediction


Prediction For Wednesday BANKNIFTY can go up if it goes above 52,000 or down after the level of 51,000, but it also depends upon the Global cues.
Bank Nifty is attempting a short-term recovery after a sharp decline, but the broader trend remains cautious unless key resistance levels are reclaimed. On the downside, the 51,000–50,500 zone is a crucial support area; holding above this range can help the index stabilize and sustain a pullback. However, a breakdown below 50,500 may trigger renewed selling pressure and extend the downside. On the upside, 52,000 is the immediate resistance, followed by a stronger hurdle in the 54,000 zone, where selling pressure is likely to emerge. A sustained move above 52,000 could lead to a bounce towards 54,000, but a decisive breakout above 54,000 is needed to confirm a stronger trend reversal. Until then, the index may remain range-bound with a cautious bias.
| Highest Call Writing at | 52,000 (6.4 Lk) |
| Highest Put Writing at | 51,000 (5.9 Lk) |
Bank Nifty Support and Resistance
| Support | 51,000 – 50,500 |
| Resistance | 52,000 – 54,000 |
Voice Of Traders by Spider Software
He Lost ₹45L… Then Built the 1-Min ‘Elephant Candle’ Strategy (Setup Revealed)… (Full Strategy Explained)

Disclaimer: The information provided in this Blog is for educational purposes only and should not be construed as financial advice. Trading in the stock market involves a significant level of risk and can result in both profits and losses. Spider Software & Team does not guarantee any specific outcome or profit from the use of the information provided in this Blog. It is the sole responsibility of the viewer to evaluate their own financial situation and to make their own decisions regarding any investments or trading strategies based on their individual financial goals, risk tolerance, and investment objectives. Spider Software & Team shall not be liable for any loss or damage, including without limitation any indirect, special, incidental or consequential loss or damage, arising from or in connection with the use of this blog or any information contained herein. ![]()