
In today’s stock market, Markets closed higher in a volatile session; Nifty held 24,350, Sensex gained 260 points.
Stock Market Nifty Chart Prediction


On April 02, Sensex was up 259.75 points at 80,501.99, and the Nifty was up 12.50 points at 24,346.70. About 1672 shares advanced, -2122 shares declined, and 134 shares unchanged.
Top Nifty gainers: Adani Ports, IndusInd Bank, Bajaj Finance, Reliance Industries, SBI
Top Nifty Losers: JSW Steel, Eicher Motors, Bajaj Auto, Hero MotoCorp, HDFC Life.
On the sectoral front, media, energy, IT, oil & gas up 0.3-0.7 percent, while power, metal, telecom, pharma, realty, consumer durables down 0.5-2 percent.
BSE Midcap index was down 0.4%, while smallcap index ended flat
Stock Prediction for 5th May 2025
| STOCK | Good Above | Weak Below |
| GODREJPROP | 2256 | 2232 |
| ICICIGI | 1880 | 1860 |
| MUTHOOTFIN | 2185 | 2162 |
| UPL | 683 | 676 |
Prediction for Monday NIFTY can go up if it goes above 24,400 or down after the level of 24,100, but it all depends upon the Global cues.
Indian stock market ended the session on a largely sideways note, with benchmark indices reflecting mixed trends amid heightened volatility and bouts of profit booking. The Nifty 50 closed almost unchanged, adding just 12.5 points to settle at 24,347. On the daily chart, the index formed a spinning top pattern, signaling market indecision at higher levels. However, the weekly chart displayed a robust green candle, pointing to underlying bullish momentum. Key resistance lies in the 24,600–25,000 zone, while crucial support is seen between 24,000 and 23,600.
| Highest Call Writing at | 24,600 |
| Highest Put Writing at | 24,000 |
Nifty Support and Resistance
| Support | 24,000-23,600 |
| Resistance | 24,600-25,000 |
Bank Nifty Daily Chart Prediction

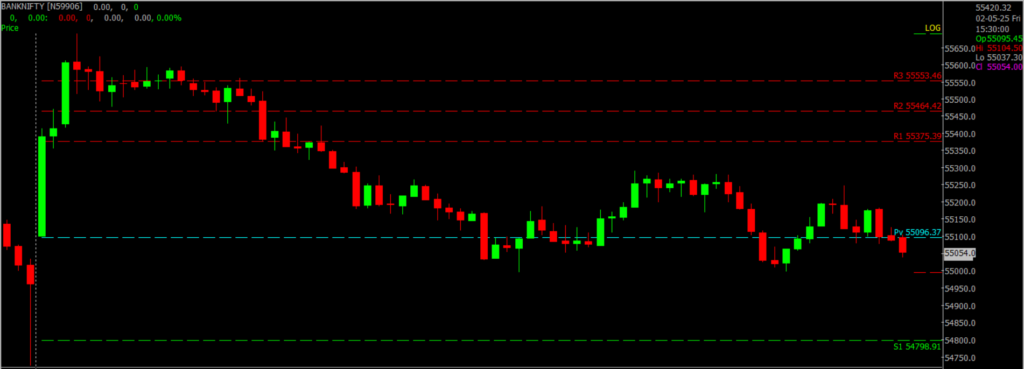
Prediction For Monday, BANKNIFTY can go up if it goes above 55,500 or down after the level of 55,000, but it all depends upon the Global cues.
Bank Nifty index had a flat opening on Friday and saw some early buying interest; however, it later gave up gains due to profit booking and ultimately closed unchanged at 55,115. A doji candle formed on the daily chart, reflecting indecision in the market, while the weekly chart displayed a shooting star pattern, suggesting caution at higher levels. Resistance is expected around the 55,500–56,000 range, with support positioned between 54,900 and 54,500.
| Highest Call Writing at | 55,500 |
| Highest Put Writing at | 54,900 |
Bank Nifty Support and Resistance
| Support | 55,000 and 54,500 |
| Resistance | 55,500 and 56,000 |
Power of Algorithms in Options Trading, Try Spider Now: Register Now
If you’d like to know how we analyze the market and provide accurate levels every day. then click on the Free Demo button below and change your trading life for good. 5X returns are possible in options trading If you have Spider Software in your trading system.
Disclaimer: The information provided in this Blog is for educational purposes only and should not be construed as financial advice. Trading in the stock market involves a significant level of risk and can result in both profits and losses. Spider Software & Team does not guarantee any specific outcome or profit from the use of the information provided in this Blog. It is the sole responsibility of the viewer to evaluate their own financial situation and to make their own decisions regarding any investments or trading strategies based on their individual financial goals, risk tolerance, and investment objectives. Spider Software & Team shall not be liable for any loss or damage, including without limitation any indirect, special, incidental or consequential loss or damage, arising from or in connection with the use of this blog or any information contained herein. ![]()