
In today’s stock market, Nifty slips below 26,200, Sensex falls 370 points; oil & gas stocks decline while pharma advances.
Stock Market Nifty Chart Prediction
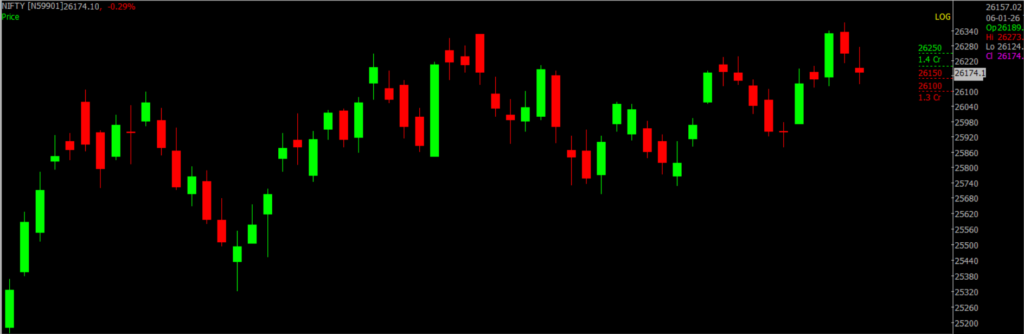
On Jan 6, Sensex was down 376.28 points at 85,063.34, while the Nifty slipped 71.60 points to 26,178.70. Around 1,483 shares advanced, 2,342 declined, and 144 remained unchanged.
Top Nifty gainers: Nestle India, Bharat Electronics, Eicher Motors, Asian Paints, Tata Steel.
Top Nifty Losers : Apollo Hospitals, ICICI Bank, HDFC Life, Sun Pharma and Tata Consumer
Among sectors, IT, pharma, PSU Bank, metal rose 0.3-1.7 percent, while Infra, media, oil &gas, capital goods down 0.6-1.6 percent.
BSE Midcap and smallcap indices ended lower.
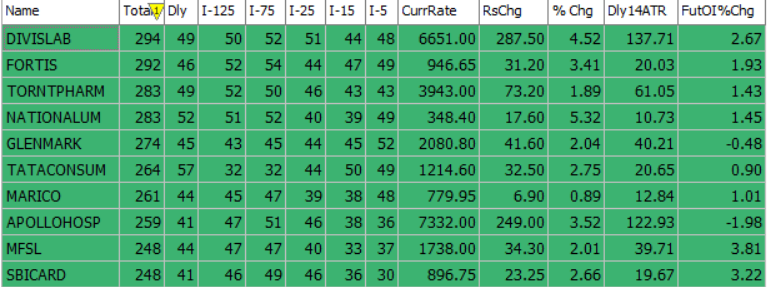
Best Stocks of the day according to AI (Delta Dash)
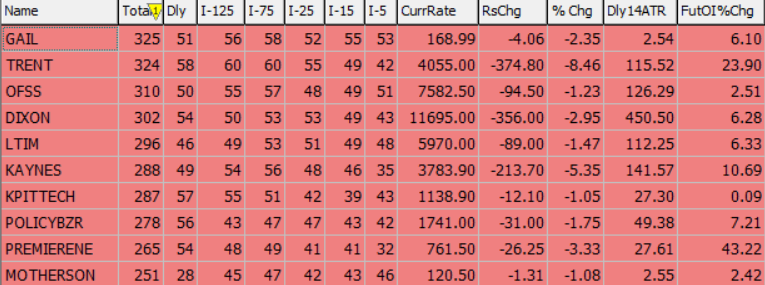
Worst Stocks of the day according to AI (Delta Dash)
Stock Prediction for 07th January 2026
| STOCK | Good Above | Weak Below |
| DELHIVERY | 415 | 411 |
| FORTIS | 954 | 944 |
| SBICARD | 900 | 892 |
| TATACONSUM | 1220 | 1208 |
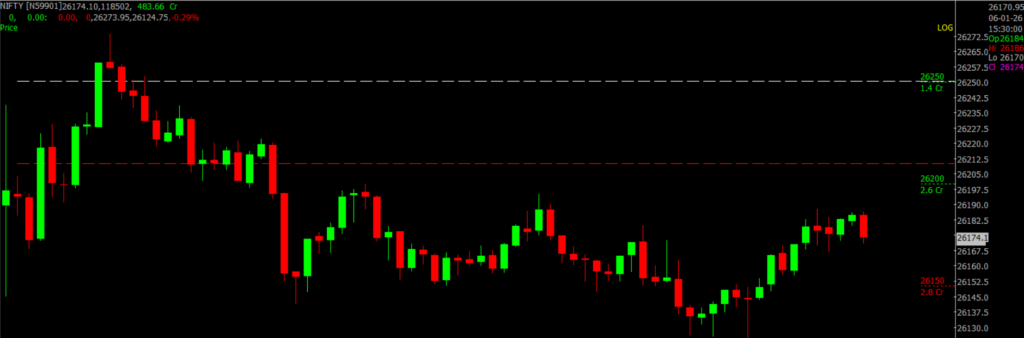
Prediction for Wednesday NIFTY can go up if it goes above 26,100 or down after the level of 26,000, but it also depends upon the Global cues.
If tensions rise and the US carries out another military strike on Venezuela, it could trigger a major geopolitical shock, potentially leading to a prolonged conflict and influencing investor sentiment as well as gold and silver prices into 2026. Meanwhile, the Nifty has slipped after hitting a new lifetime high yesterday, with weakness persisting. The index found intraday support near 26,100 and is expected to remain range-bound in the near term, with resistance in the 26,100–26,300 zone and support between 26,000 and 25,700.
| Highest Call Writing at | 26,300 (1.4 cr) |
| Highest Put Writing at | 26,200 (1.3 cr) |
Nifty Support and Resistance
| Support | 26,100 and 25,900 |
| Resistance | 26,100–26,300 |
Bank Nifty Daily Chart Prediction
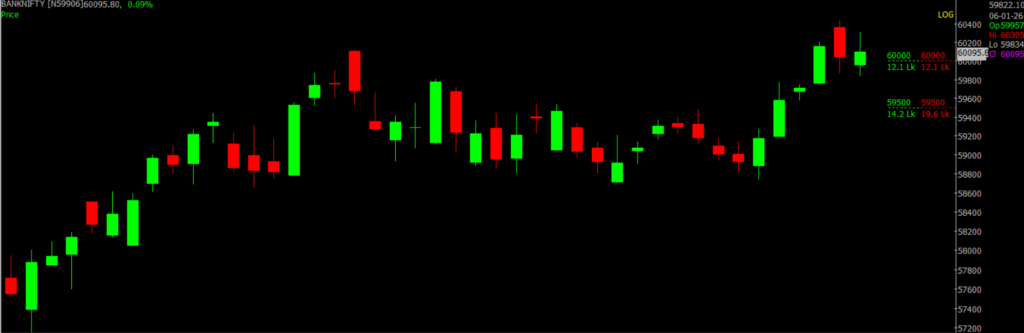
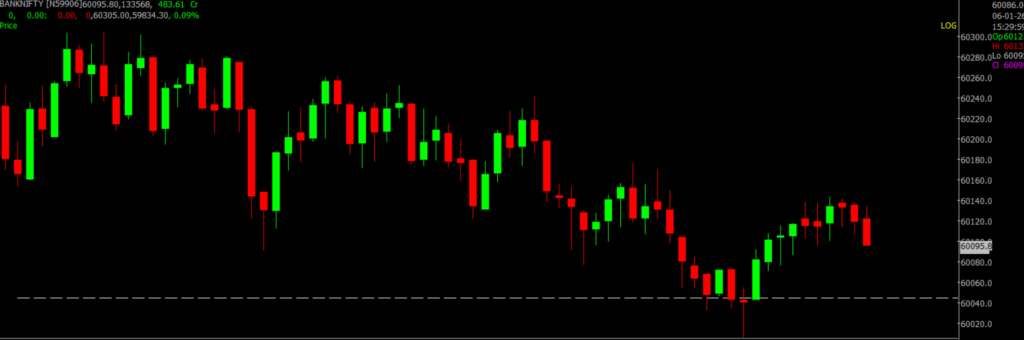
Prediction For Wednesday BANKNIFTY can go up if it goes above 60,000 or down after the level of 59,800, but it also depends upon the Global cues.
From a chart perspective, Bank Nifty has broken out of a falling trendline on the daily chart and is consolidating at higher levels while staying above its short-term 50 SMA on the hourly timeframe. The daily RSI shows a bullish crossover and is positioned near 65, reflecting strong positive momentum.
On the hourly chart, the index continues to trade above its 50 SMA, supporting the bullish bias. A buy-on-dips approach remains valid as long as Bank Nifty holds above 59,300. Resistance lies in the 60,000–60,500 zone, while support is placed between 59,800 and 59,500.
| Highest Call Writing at | 60,000 (12.1 Lk) |
| Highest Put Writing at | 59,800 (19.6 Lk) |
Bank Nifty Support and Resistance
| Support | 59,800 and 59,500 |
| Resistance | 60,000–60,500 |
Voice Of Traders by Spider Software
HDFC Securities’ SECRET Stock Picking Formula! (STRATEGY REVEALED)

Disclaimer: The information provided in this Blog is for educational purposes only and should not be construed as financial advice. Trading in the stock market involves a significant level of risk and can result in both profits and losses. Spider Software & Team does not guarantee any specific outcome or profit from the use of the information provided in this Blog. It is the sole responsibility of the viewer to evaluate their own financial situation and to make their own decisions regarding any investments or trading strategies based on their individual financial goals, risk tolerance, and investment objectives. Spider Software & Team shall not be liable for any loss or damage, including without limitation any indirect, special, incidental or consequential loss or damage, arising from or in connection with the use of this blog or any information contained herein. ![]()