Volume helps traders measure market strength by showing buying and selling activity and confirming price trends.
Why Volume Matters
Volume acts as a measure of market participation. When a stock moves with high volume, it indicates strong interest from buyers or sellers. Conversely, low volume often suggests uncertainty or a lack of conviction among market participants.
High Volume Signals Strength
- Rising prices with increasing volume indicate strong buying interest and a likely continuation of the uptrend.
- Falling prices with increasing volume indicate strong selling pressure and a likely continuation of the downtrend.
Low Volume Signals Weakness
- Rising prices with declining volume may indicate weakening buyer interest and a possible reversal.
- Falling prices with declining volume may indicate weakening seller interest and a potential bottom formation.
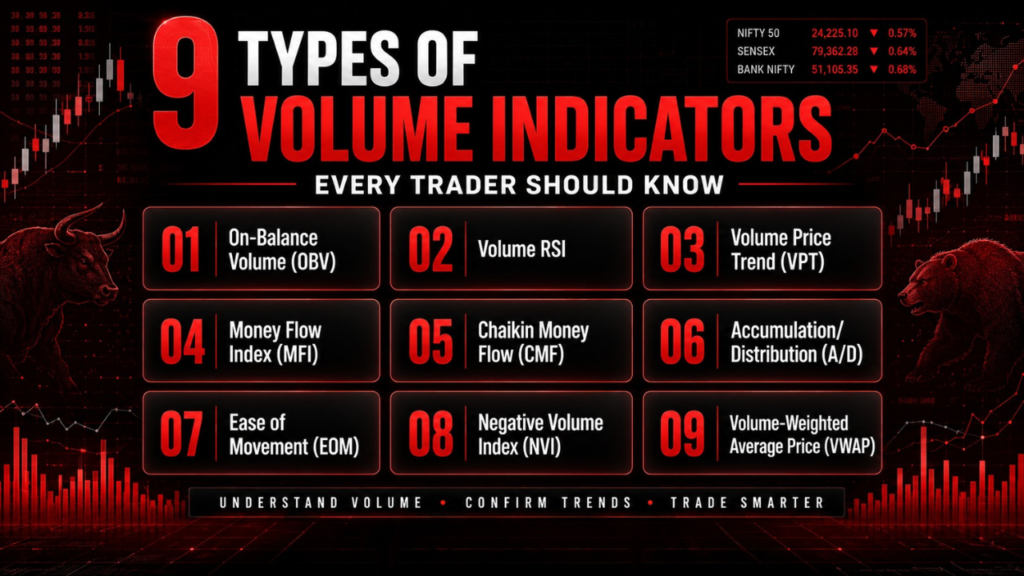
Top 9 Volume Indicators Every Trader Should Know
1. On-Balance Volume (OBV)
OBV measures buying and selling pressure by adding volume on up days and subtracting volume on down days. Traders focus on the direction of OBV rather than its actual value.
Key Use: Confirms trends and identifies bullish or bearish divergences between price and volume.
2. Volume RSI
Volume RSI applies the Relative Strength Index concept to volume instead of price.
- Above 50: Bullish volume dominates.
- Below 50: Bearish volume dominates.
Key Use: Identifies shifts in buying and selling momentum.
3. Volume Price Trend (VPT)
VPT combines volume and price changes to measure money flow into or out of a stock.
Key Use: Confirms trends and detects positive or negative divergences before reversals occur.
4. Money Flow Index (MFI)
Known as the volume-weighted RSI, MFI combines price and volume to measure buying and selling pressure.
Key Use: Identifies overbought and oversold conditions while confirming trend strength.
5. Chaikin Money Flow (CMF)
CMF measures the flow of money into and out of a stock over a selected period.
- Above Zero: Bullish accumulation.
- Below Zero: Bearish distribution.
Key Use: Confirms breakouts and detects trend reversals through divergence analysis.
6. Accumulation/Distribution Line (A/D Line)
The A/D Line tracks whether money is flowing into or out of a stock by analyzing price and volume together.
Key Use: Helps identify institutional buying and selling activity before major price moves.
7. Ease of Movement (EMV)
EMV measures how easily a stock’s price moves based on volume.
Key Use: Works best in volatile markets and helps identify emerging trends.
8. Negative Volume Index (NVI)
NVI assumes that “smart money” is active on days when trading volume decreases.
Key Use: Helps traders identify long-term bullish and bearish market conditions.
9. Volume-Weighted Average Price (VWAP)
VWAP calculates the average price a stock trades at throughout the day while considering both price and volume.
Key Use: Used by intraday traders to determine fair value and identify trend direction.
- Price above VWAP: Bullish trend.
- Price below VWAP: Bearish trend.
How Traders Use Volume Indicators
Successful traders rarely rely on price action alone. By combining volume indicators with technical analysis tools such as support and resistance, moving averages, and chart patterns, traders can:
- Confirm the strength of trends.
- Identify potential reversals early.
- Validate breakout and breakdown signals.
- Improve entry and exit timing.
- Understand market sentiment more effectively.
Conclusion
Volume is often called the “fuel” behind price movements. While price shows the market’s direction, volume reveals the conviction behind that move. Indicators such as OBV, MFI, CMF, VWAP, and VPT provide valuable insights into buying and selling pressure, helping traders make more informed decisions. By incorporating volume analysis into your trading strategy, you can gain a deeper understanding of market behavior and improve your overall trading performance.
Voice Of Traders by Spider Software
He Lost ₹45L… Then Built the 1-Min ‘Elephant Candle’ Strategy (Setup Revealed)… (Full Strategy Explained)

Disclaimer: The information provided in this Blog is for educational purposes only and should not be construed as financial advice. Trading in the stock market involves a significant level of risk and can result in both profits and losses. Spider Software & Team does not guarantee any specific outcome or profit from the use of the information provided in this Blog. It is the sole responsibility of the viewer to evaluate their own financial situation and to make their own decisions regarding any investments or trading strategies based on their individual financial goals, risk tolerance, and investment objectives. Spider Software & Team shall not be liable for any loss or damage, including without limitation any indirect, special, incidental or consequential loss or damage, arising from or in connection with the use of this blog or any information contained herein. ![]()