In this blog, we will explore the most popular candlestick patterns every trader should know for better trading decisions.
1. Bullish Engulfing Pattern
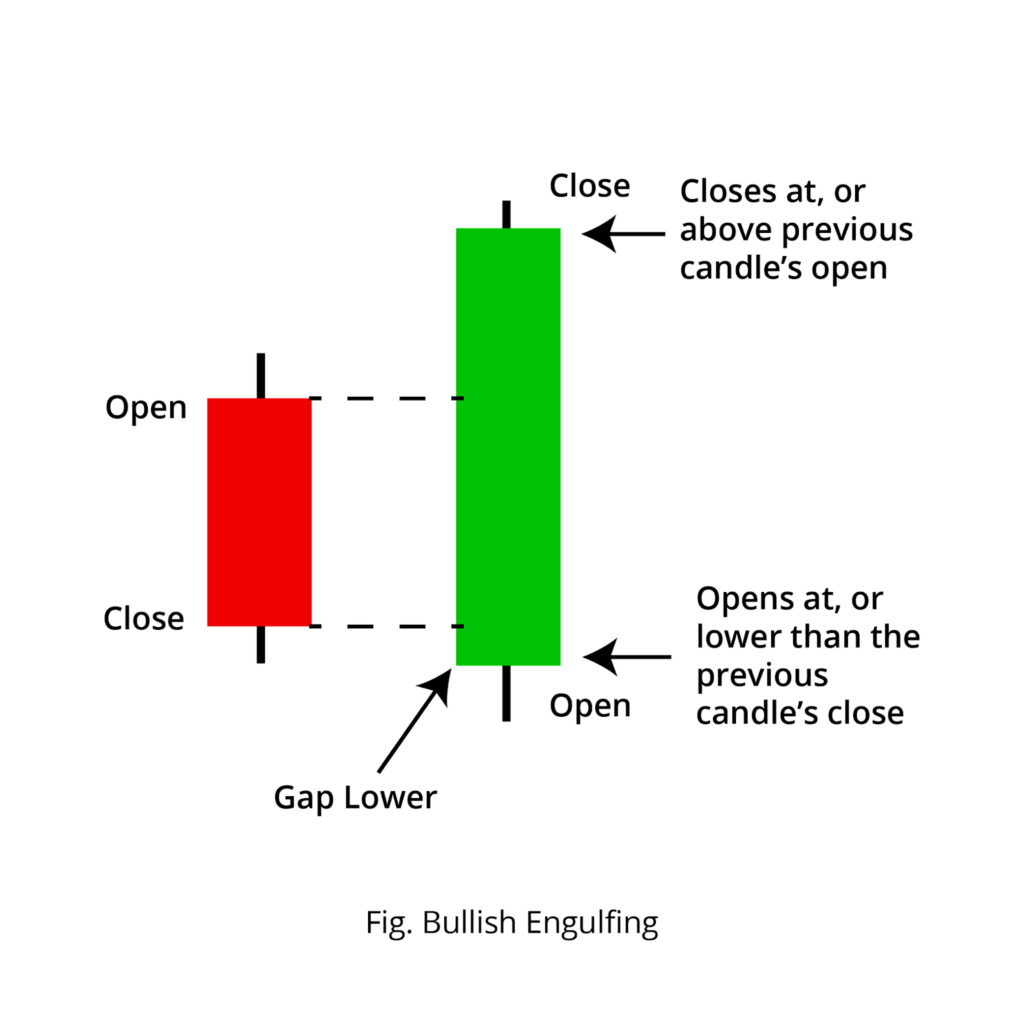
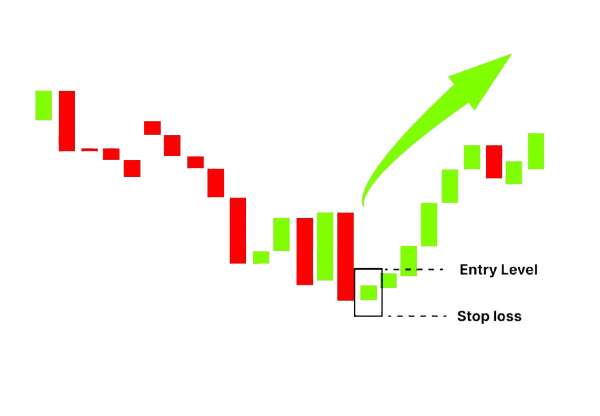
The Bullish Engulfing Pattern is a two-candle formation:
- A small bearish (red) candle
- Followed by a larger bullish (green) candle
What it Indicates:
The bullish candle completely covers the previous bearish candle, showing strong buying pressure and signaling a potential upward trend reversal.
2. Hammer Pattern
Hammer is a single candlestick pattern with
- A small body candle, and
- Long lower shadow/wick
What Hammer Pattern Indicates:
Whenever the chart is in a downtrend, and a Hammer candlestick is made, it indicates that the share price might go up because the buyers have become more dominant or active.
3. Bullish Harami Pattern
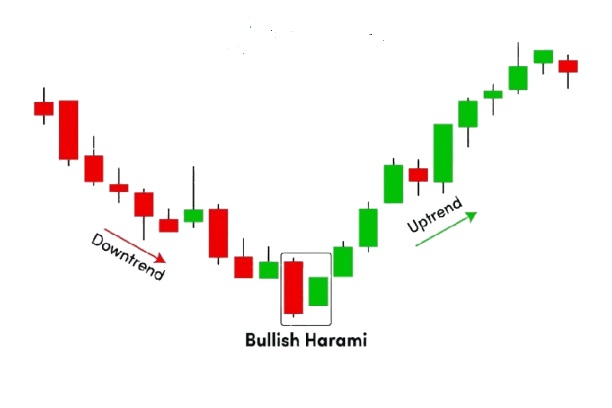
The Bullish Harami is a two-candle pattern that may indicate a potential trend reversal to the upside. It forms when a small bullish candle appears completely within the body of a larger bearish candle.
What it Indicates:
This pattern reflects weakening selling pressure and suggests that buyers may be gaining control, signaling a possible bullish reversal.
4. Three White Soldiers
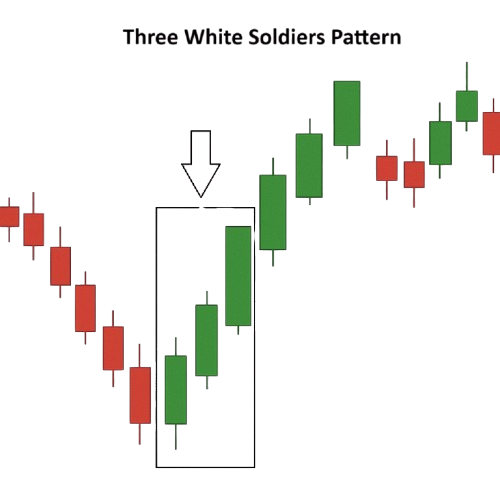
The Three White Soldiers pattern is formed by three consecutive bullish candles with small wicks. Each candle opens within the previous candle’s body and closes higher than the previous day’s close.
What it Indicates:
This pattern signals strong buying momentum and suggests a potential reversal from a downtrend to an uptrend.
5. Dragonfly Doji
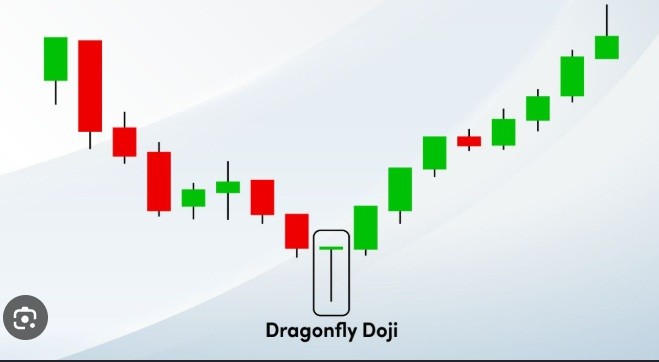
The Dragonfly Doji is a single-candle pattern with a long lower shadow and little to no body, usually appearing after a downtrend.
What it Indicates:
This pattern shows that sellers pushed prices lower, but buyers regained control and pushed the price back near the opening level. It signals potential bullish reversal momentum. Unlike the Hammer pattern, the Dragonfly Doji has almost no real body, while the Hammer has a small body.
Voice Of Traders by Spider Software
He Lost ₹45L… Then Built the 1-Min ‘Elephant Candle’ Strategy (Setup Revealed)… (Full Strategy Explained)

Disclaimer: The information provided in this Blog is for educational purposes only and should not be construed as financial advice. Trading in the stock market involves a significant level of risk and can result in both profits and losses. Spider Software & Team does not guarantee any specific outcome or profit from the use of the information provided in this Blog. It is the sole responsibility of the viewer to evaluate their own financial situation and to make their own decisions regarding any investments or trading strategies based on their individual financial goals, risk tolerance, and investment objectives. Spider Software & Team shall not be liable for any loss or damage, including without limitation any indirect, special, incidental or consequential loss or damage, arising from or in connection with the use of this blog or any information contained herein. ![]()