
Nifty reached a new all-time high on Wednesday & continued its momentum today as well, driven by various factors in the market. The question now is: How long will this trend last?
The Contribution of FIIs to the Nifty All-Time Highs

In June, the Nifty rollovers increased to 76.1%, higher than the previous expiry’s 70.6%. Foreign Institutional Investors (FIIs) also increased their net long position in index futures, contributing to Nifty creating All-Time Highs.
Experts believe that India is an attractive option for manufacturers and investors looking for alternatives to China. Mid and small-cap stocks have performed well, contributing to the broad-based rally in Indian equities. Analysts suggest that with reasonable valuations, the Nifty could even reach 21,000. The index currently trades at 17.7 times its estimated earnings for the fiscal year 2025.
Anu Jain & Ashish Mittal of 360 ONE Wealth predict that the index earnings will experience an average annual growth of around 16% from FY23 to FY25.
They anticipate that the Nifty index will maintain a higher valuation and potentially trade around the +1 standard deviation mark, reflecting a price-to-earnings (P/E) ratio of approximately 20 or higher. This projection suggests that the Nifty index could potentially reach a level of around 21,000, again breaking Nifty’s New High.
The Impact of the Current Climate & Economical Situation on the Nifty All-Time Highs
The ongoing monsoon season in India is providing positive momentum to the overall market & Nifty. If concerns about the El Nino weather phenomenon diminish, investors expect a more sustained upward movement in the market.
With the monsoon season underway and the Reserve Bank of India pausing on interest rate changes, there is optimism that strong earnings growth will continue. Given the current market valuations, experts believe that the market will likely continue its upward trend and remain positive.
The Chartists predict that the Nifty index could potentially reach levels around 19,500-19,900-20,100 in the medium term.
What the weekly chart of Nifty says?
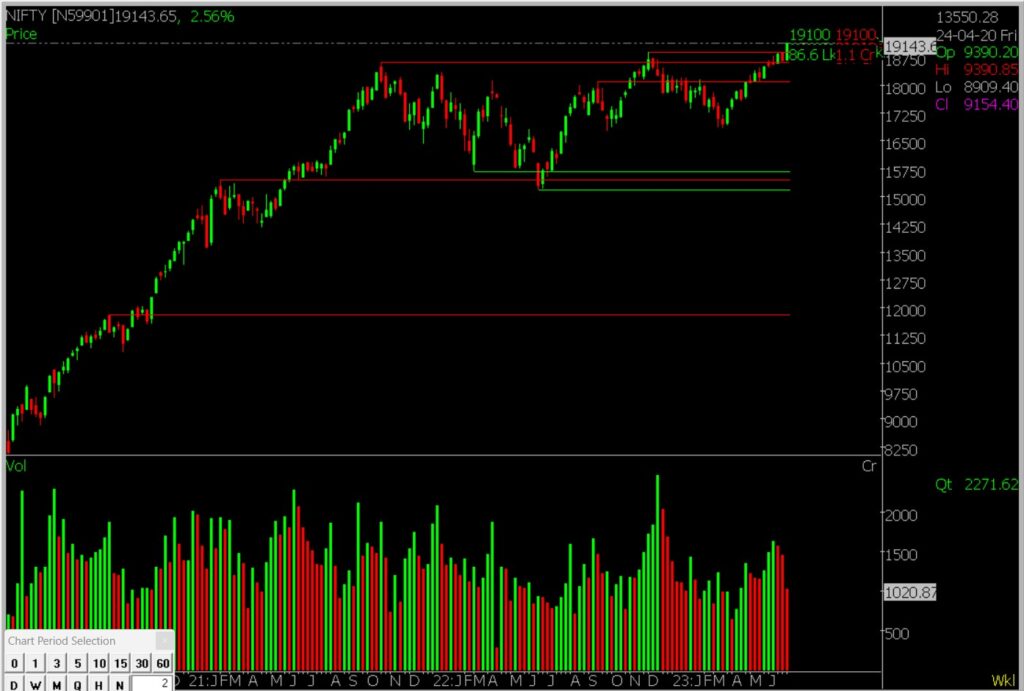
Nifty’s weekly chart shows a positive trend as it has successfully invalidated a dark cloud cover pattern. Rupak De, a Senior Technical Analyst, expects the overall trend to remain positive as long as Nifty stays above the support level of 18,700. This support level is significant because it is where put writers, who provide downside protection, are actively positioned to prevent a major decline in the index.
On the upside, the immediate resistance for Nifty is at 19,000. If Nifty breaks above this level convincingly, it may lead to a further upward movement toward the 19,450 level, eventually creating Nifty All-Time Highs
What can be the Drawbacks?
The current challenge lies in the global geopolitical situation and the potential tightening of interest rates by major central banks around the world. These factors could affect the market’s performance, failing to reach new Nifty All-Time Highs Record. Additionally, any negative surprises in the upcoming Q1 earnings season could also impact the overall market sentiment.
According to Apurva Sheth, an expert from SAMCO Securities, it’s important to keep an eye on the IT and banking sectors. The IT sector is yet to fully participate in the market rally and has room for growth. On the other hand, the banking sector holds significant weightage in the market index and could play a crucial role in driving the market further.
To Sum Up
In summary, Indian stocks received a $10 billion investment from FIIs in Q1 FY24, driving a strong market rally. Investors are increasingly favoring India as an alternative to China. Mid and small-cap stocks performed well, and the Nifty index may reach 21,000. The positive impact of monsoons and the Reserve Bank of India’s rate pause also contribute to market positivity. However, it is important to consider global tensions and potential Q1 earnings surprises for their impact on the market.
Also, Check out our article on Factors behind Nifty’s All-Time High Achievement 2023.
Disclaimer: The information provided in this Blog is for educational purposes only and should not be construed as financial advice. Trading in the stock market involves a significant level of risk and can result in both profits and losses. Spider Software & Team does not guarantee any specific outcome or profit from the use of the information provided in this Blog. It is the sole responsibility of the viewer to evaluate their own financial situation and to make their own decisions regarding any investments or trading strategies based on their individual financial goals, risk tolerance, and investment objectives. Spider Software & Team shall not be liable for any loss or damage, including without limitation any indirect, special, incidental or consequential loss or damage, arising from or in connection with the use of this blog or any information contained herein. ![]()