
In today’s stock market, Nifty crosses 23,600, while Sensex jumps 1,700 points as hopes of a US-Iran peace deal boost market sentiment.
Stock Marspin maya casinoket Nifty Chart Prediction

On June 12, Sensex was up 1,695.40 points at 75,527.95, while Nifty gained 461.30 points to reach 23,622.90. Around 3,110 stocks advanced, 969 declined, and 149 remained unchanged.
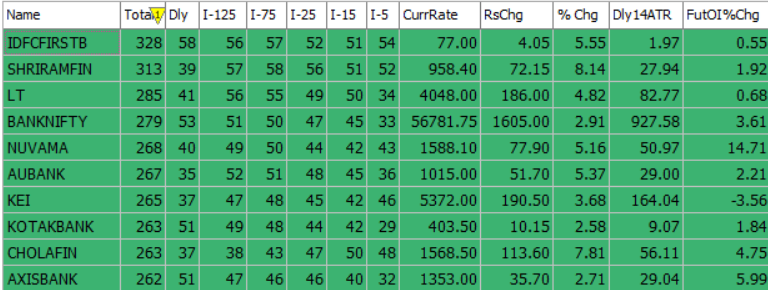
Top Nifty gainers: Shriram Finance, L&T, InterGlobe Aviation, Bajaj Finance and Titan Company
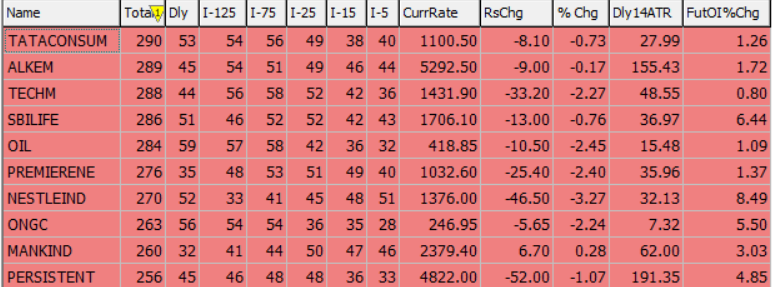
Top Nifty Losers : Nestle India, ONGC, Tech Mahindra, Tata Consumer and SBI Life Insurance
Sectorally, all indices closed in positive territory. Consumer durables, realty, telecom, banking, auto, media, oil & gas and metal indices gained 1-2 percent.
The broader market outperformed the benchmarks, with the Nifty Midcap 100 and Nifty Smallcap 100 indices rising more than 2 percent each.
Best Stocks aviatorof the day according to AI (Delta Dash)
Worst Stocks of thteen pattie day according to AI (Delta Dash)
Stock Prediction for 15 June 2026
| STOCK | Good Above | Weak Below |
| AUBANK | 1024 | 1014 |
| BPCL | 304 | 300 |
| LT | 4070 | 4030 |
| SHRIRAMFIN | 961 | 951 |
Prediction for Monday NIFTY can go up if it goes above 23,600 or down after the level of 23,400, but it also depends upon the Global cues.
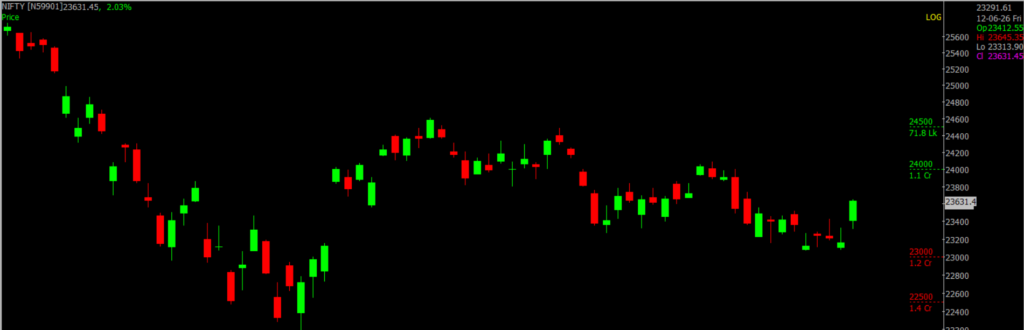
Nifty opened with a strong gap-up on optimism surrounding a potential U.S.-Iran deal. However, profit booking at higher levels dragged the index towards the 23,322–23,312 zone. The index found support in this range on two occasions and staged a sharp recovery in the second half of the session. Strong buying interest helped Nifty close at 23,631, gaining 469.80 points for the day.
On the daily chart, Nifty formed a strong bullish candle with a noticeable lower wick, indicating buying interest at lower levels. The RSI has turned higher, signalling a revival in bullish momentum, while the index reclaimed its 20-day EMA for the first time since 27 May. Going forward, 23,600–24,000 remains the key resistance zone, while 23,400–23,000 is expected to act as an important support area.
| Highest Call Writing at | 23,600 (1.2 cr) |
| Highest Put Writing at | 23,400 (1.1 cr) |
Nifty Support and Resistance
| Support | 23,400–23,000 |
| Resistance | 23,600–24,000 |
Bank Nifty Daily Chart Prediction
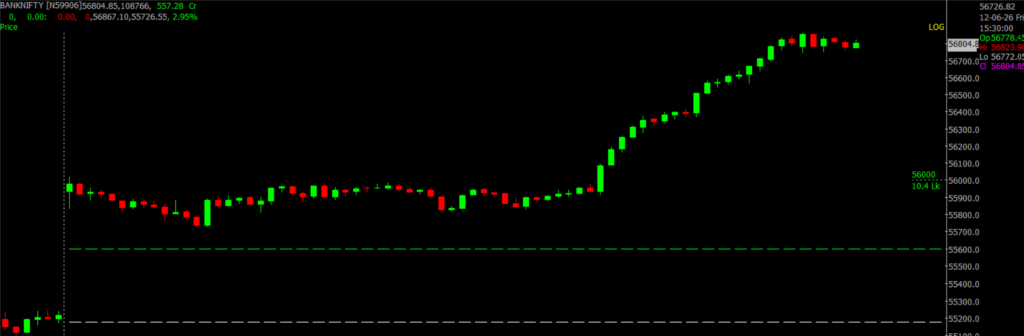
Prediction For Monday BANKNIFTY can go up if it goes above 56,800 or down after the level of 55,900, but it also depends upon the Global cues.
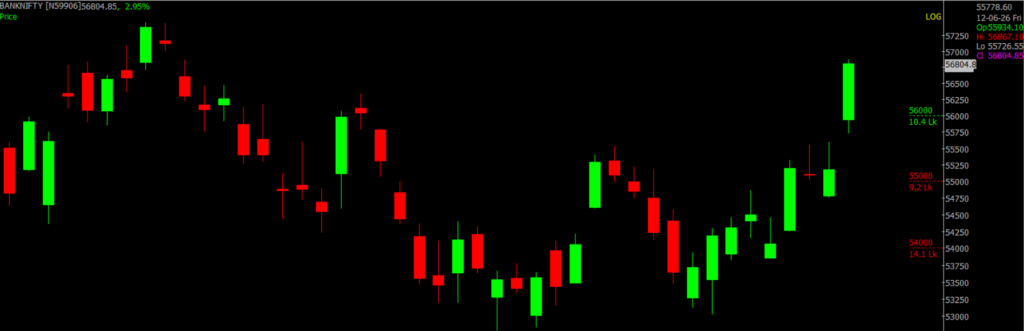
Bank Nifty opened with a gap-up and traded within a narrow range for most of the session. However, a breakout from this consolidation in the second half sparked strong buying interest, helping the index rally sharply and close at 56,815, gaining 1,640.70 points.
With this move, Bank Nifty has reclaimed and closed above its key short-term and long-term moving averages, indicating improving strength. The RSI continues to trend higher, signalling strengthening bullish momentum. Additionally, the DI+ line has crossed above the DI− line on the ADX indicator, reflecting increasing buyer dominance. The MACD remains above the zero line with expanding positive histogram bars, further supporting the bullish outlook. Going forward, 56,800–57,500 remains the key resistance zone, while 55,900–55,000 is expected to act as an important support area.
| Highest Call Writing at | 56,800 (10.4 Lk) |
| Highest Put Writing at | 55,900 (9.2 Lk) |
Bank Nifty Support and Resistance
| Support | 55,900–55,000 |
| Resistance | 56,800–57,500 |
Voice Of Traders by Spider Software
He Lost ₹45L… Then Built the 1-Min ‘Elephant Candle’ Strategy (Setup Revealed)… (Full Strategy Explained)

Disclaimer: The information provided in this Blog is for educational purposes only and should not be construed as financial advice. Trading in the stock market involves a significant level of risk and can result in both profits and losses. Spider Software & Team does not guarantee any specific outcome or profit from the use of the information provided in this Blog. It is the sole responsibility of the viewer to evaluate their own financial situation and to make their own decisions regarding any investments or trading strategies based on their individual financial goals, risk tolerance, and investment objectives. Spider Software & Team shall not be liable for any loss or damage, including without limitation any indirect, special, incidental or consequential loss or damage, arising from or in connection with the use of this blog or any information contained herein. ![]()