
In today’s stock market, Nifty at 26,200 as Sensex stays flat; pharma rises while oil & gas drag amid market volatility.
Stock Market Nifty Chart Prediction
On Nov 27, Sensex was up 110.87 points at 85,720.38, and the Nifty was up 10.25 points at 26,215.55. About 1,900 shares advanced, 2,073 declined, and 167 were unchanged.
Top Nifty gainers: Adani Enterprises, M&M, Adani Ports, Sun Pharma, HUL
Top Nifty Losers : SBI Life Insurance, Shriram Finance, HDFC Life, Power Grid Corp and Bharti Airtel
On the sectoral front, pharma, media, auto rose 0.5-1%, while power, oil & gas, telecom shed 0.5-1% each.
BSE Midcap and smallcap indices ended on a flat note.
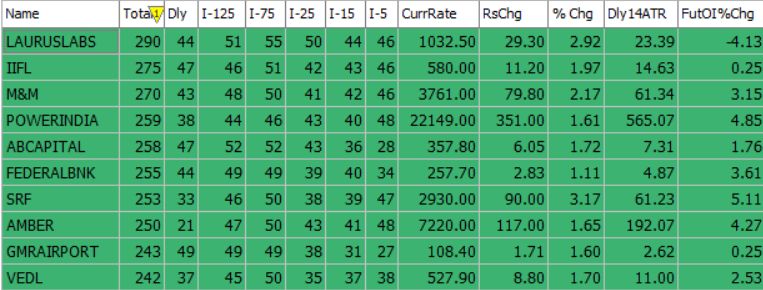
Best Stocks of the day according to AI (Delta Dash)
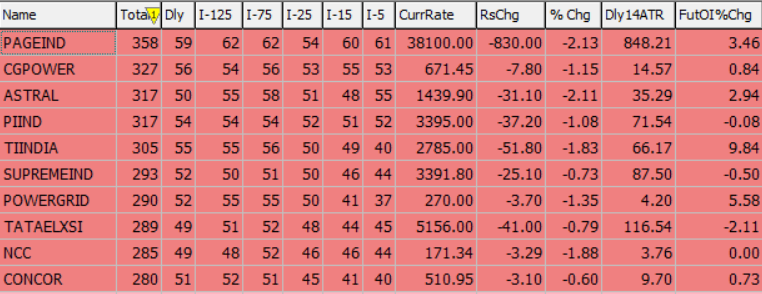
Worst Stocks of the day according to AI (Delta Dash)
Stock Prediction for 1st December 2025
| STOCK | Good Above | Weak Below |
| 360ONE | 1185 | 1174 |
| KPITTECH | 1226 | 1215 |
| M&M | 3782 | 3742 |
| LAURUSLAB | 1036 | 1026 |
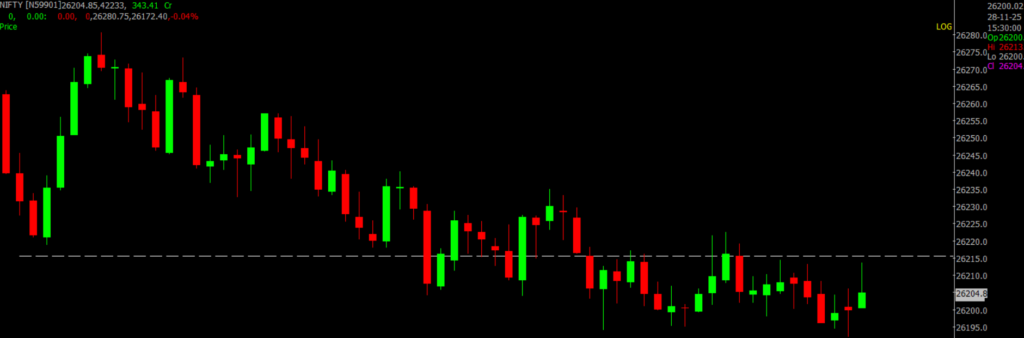
Prediction for Friday NIFTY can go up if it goes above 26,300 or down after the level of 26,100, but it also depends upon the Global cues.
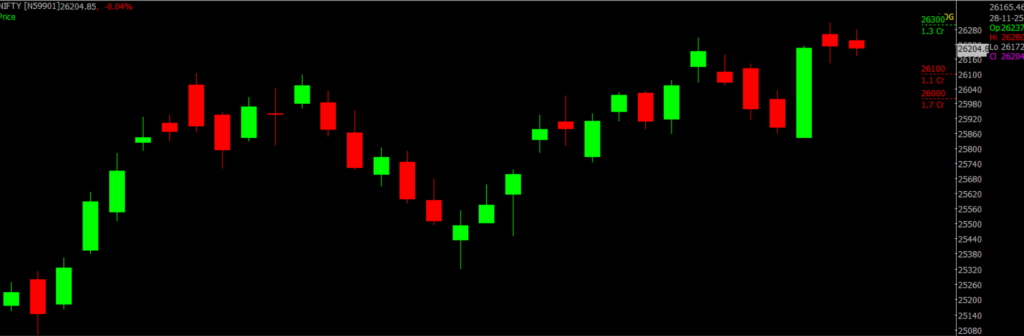
Nifty moved sideways throughout the session, forming a very narrow-bodied candle with small wicks on both ends reflecting market indecision. Despite hitting a new all-time high, the index has struggled to show strong follow-through in the last two sessions, signaling buyer hesitation at higher levels.
After breaking above a downward-sloping trendline on the weekly chart in mid-October, the index climbed further and later retested this breakout zone in early November, which held as support. Since that rebound, Nifty has seen a steady upmove and has now posted three consecutive weekly gains.
The RSI has flattened in recent sessions and the MACD momentum has also cooled, hinting at a temporary pause. A decisive move above the recent record highs could trigger the next leg of the rally. Key resistance is expected in the 26,300–26,700 range, while support lies between 26,100 and 25,800.
| Highest Call Writing at | 26,300 (1.3 cr) |
| Highest Put Writing at | 26,100 (1.7 Cr) |
Nifty Support and Resistance
| Support | 26,300–26,700 |
| Resistance | 26,100 and 25,800 |
Bank Nifty Daily Chart Prediction
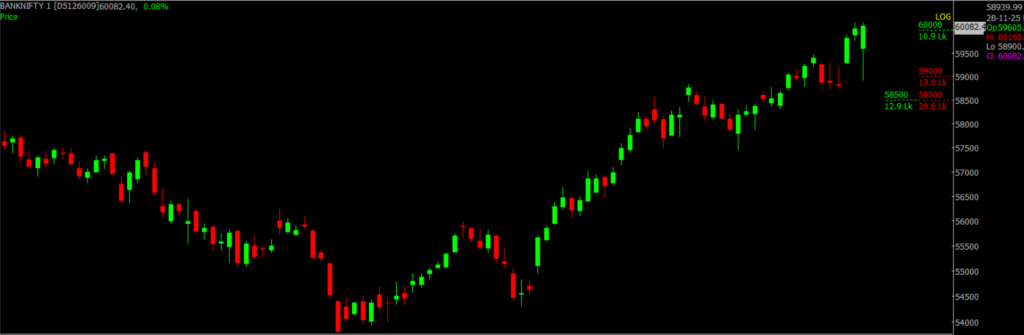
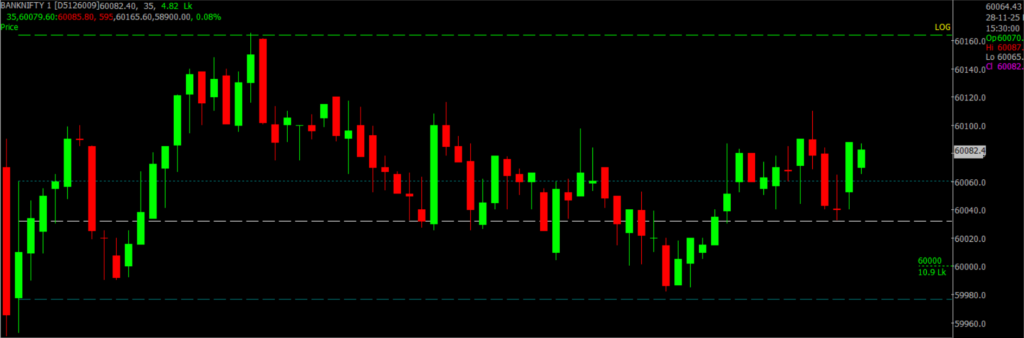
Prediction For Friday BANKNIFTY can go up if it goes above 60,000 or down after the level of 59,600, but it also depends upon the Global cues.
Bank Nifty formed a Doji on the daily chart, reflecting indecision among traders. Since the trendline breakout on the weekly chart in early October, the index has rallied strongly and continued to outperform Nifty. Its price structure remains constructive, suggesting scope for further upside. On the weekly timeframe, both RSI and ADX are trending higher, indicating strengthening momentum and a firming trend supporting the bullish outlook. Bank Nifty is likely to encounter resistance in the 60,000–60,500 region, while support lies at 59,600–59,000.
| Highest Call Writing at | 60,000 (10.9 Lk) |
| Highest Put Writing at | 59,600 (13.0 Lk) |
Bank Nifty Support and Resistance
| Support | 59,600–59,000 |
| Resistance | 60,000–60,500 |
Voice Of Traders by Spider Software
This 2% Trading Rule can make you RICH (Watch Live Results)

Disclaimer: The information provided in this Blog is for educational purposes only and should not be construed as financial advice. Trading in the stock market involves a significant level of risk and can result in both profits and losses. Spider Software & Team does not guarantee any specific outcome or profit from the use of the information provided in this Blog. It is the sole responsibility of the viewer to evaluate their own financial situation and to make their own decisions regarding any investments or trading strategies based on their individual financial goals, risk tolerance, and investment objectives. Spider Software & Team shall not be liable for any loss or damage, including without limitation any indirect, special, incidental or consequential loss or damage, arising from or in connection with the use of this blog or any information contained herein. ![]()