
In today’s stock market, Nifty ends under 23,900 amid continued market weakness, with IT stocks leading the decline.
Stock Market Nifty Chart Prediction
On April 24, The Sensex was down 953.58 points at 76,710.42, and the Nifty was down 261.35 points at 23,911.70. About 1108 shares advanced, 2736 shares declined, and 137 shares unchanged.
Top Nifty gainers: Hindalco, Coal India, Nestle, Grasim, Eicher Motors.
Top Nifty Losers : Infosys, HCL Tech, TCS, Tech Mahindra and Sun Pharma
All the sectoral indices ended in the red with IT index sheds 5%, while Healthcare, Consumer Durables, Realty, Telecom, Pharma, Media down 1% each.
Nifty Midcap and Smallcap indices declined nearly 1% each.
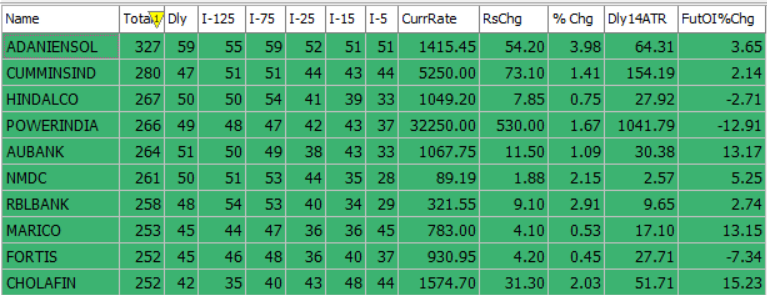
Best Stocks of the day according to AI (Delta Dash)
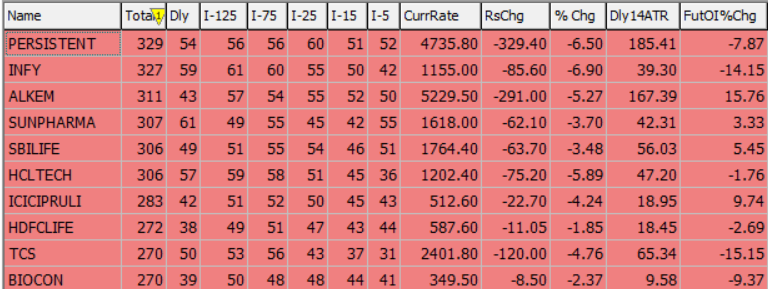
Worst Stocks of the day according to AI (Delta Dash)
Stock Prediction for 27th April 2026
| STOCK | Good Above | Weak Below |
| AUBANK | 1072 | 1062 |
| CHOLAFIN | 1578 | 1560 |
| NESTLEIND | 1425 | 1410 |
| POLICYBZR | 1702 | 1685 |
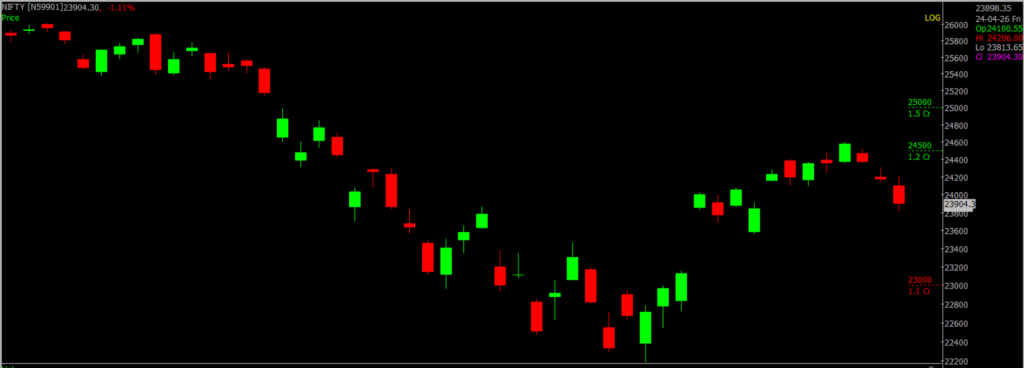
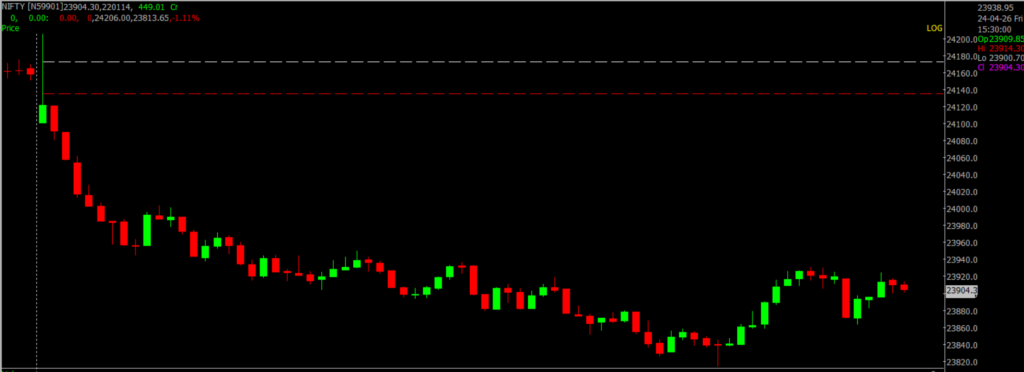
Prediction for Monday NIFTY can go up if it goes above 24,500 or down after the level of 23,800, but it also depends upon the Global cues.
Nifty is showing weakness; however, it is approaching a key support zone. Moreover, if it holds above 23,800, then a short-term bounce can emerge. On the other hand, if selling continues, then the index may drift toward 23,000. Meanwhile, the 24,200–25,000 zone will act as a strong resistance. Therefore, only a sustained move above 24,200 can revive bullish momentum. Consequently, traders should stay cautious and wait for confirmation.
| Highest Call Writing at | 24,500 (1.2 Cr) |
| Highest Put Writing at | 23,800 (1.1 Cr) |
Nifty Support and Resistance
| Support | 23,800–23,000 |
| Resistance | 24,200–25,000 |
Bank Nifty Daily Chart Prediction
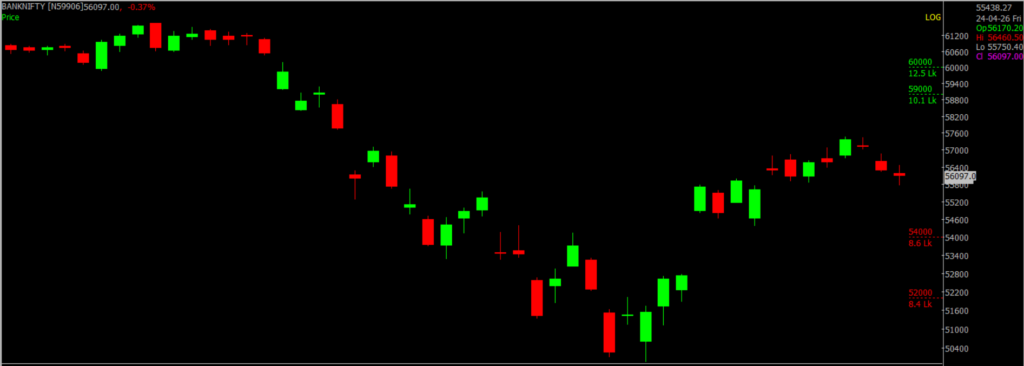
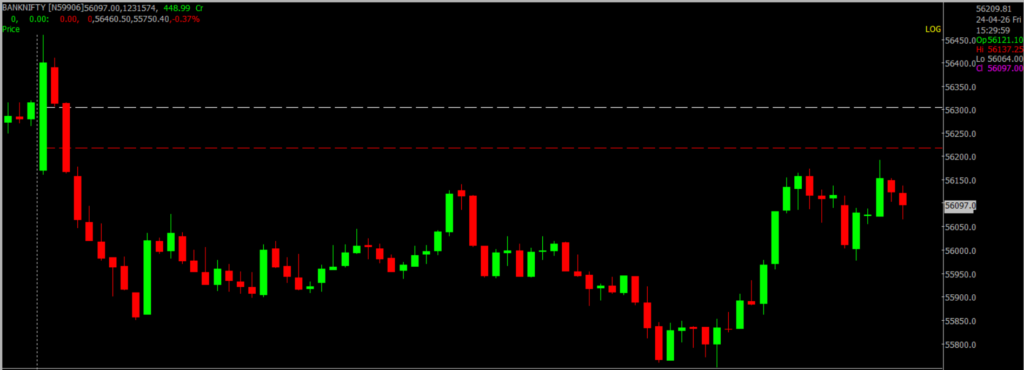
Prediction For Monday BANKNIFTY can go up if it goes above 57,000 or down after the level of 56,400, but it also depends upon the Global cues.
Bank Nifty is showing mild weakness; however, it is still trading near an important support zone. Moreover, if the index holds above 56,400, then a short-term recovery can be seen. On the other hand, if selling pressure intensifies, then it may slip toward 54,600. Meanwhile, the 57,000–59,000 range will act as a strong resistance zone. Therefore, only a sustained move above 57,000 can confirm bullish strength. Consequently, traders should remain cautious and wait for clear signals.
| Highest Call Writing at | 57,000 (10.1 Lk) |
| Highest Put Writing at | 56,400 (8.6Lk) |
Bank Nifty Support and Resistance
| Support | 56,400 and 54,600 |
| Resistance | 57,000 – 59,000 |
Voice Of Traders by Spider Software
He Lost ₹45L… Then Built the 1-Min ‘Elephant Candle’ Strategy (Setup Revealed)… (Full Strategy Explained)

Disclaimer: The information provided in this Blog is for educational purposes only and should not be construed as financial advice. Trading in the stock market involves a significant level of risk and can result in both profits and losses. Spider Software & Team does not guarantee any specific outcome or profit from the use of the information provided in this Blog. It is the sole responsibility of the viewer to evaluate their own financial situation and to make their own decisions regarding any investments or trading strategies based on their individual financial goals, risk tolerance, and investment objectives. Spider Software & Team shall not be liable for any loss or damage, including without limitation any indirect, special, incidental or consequential loss or damage, arising from or in connection with the use of this blog or any information contained herein. ![]()