
In today’s stock market, Nifty crosses 23,100, Sensex jumps 500 points; IT, metal, and realty sectors lead the rally.
Stock Market Nifty Chart Prediction
On April 07, The Sensex rose 0.69% points to 74,616. The Nifty gained 0.68% points to close at 23,123. About 2,082 shares advanced, 1,149 shares declined, and 83 shares unchanged.
Top Nifty gainers: Wipro, Hindalco Industries, HCL Technologies, TCS, Infosys,
Top Nifty Losers : Dr Reddy’s Laboratories, Adani Enterprises, Interglobe Aviatoion, Apollo Hospitals, Adani Ports.
Except Consumer Durables and PSU Bank, all other sectoral indices ended in the green with Information Technology rose 2.5%, Metal index gained 1.5%, Realty index up 1.7% and Media index jumped 1%.
The Nifty midcap index was up 0.3 percent, while smallcap index ended flat.
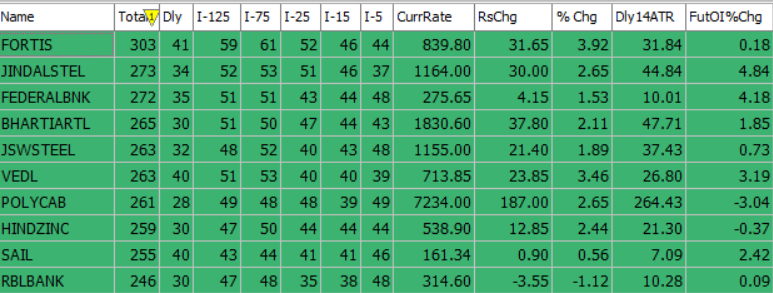
Best Stocks of the day according to AI (Delta Dash)
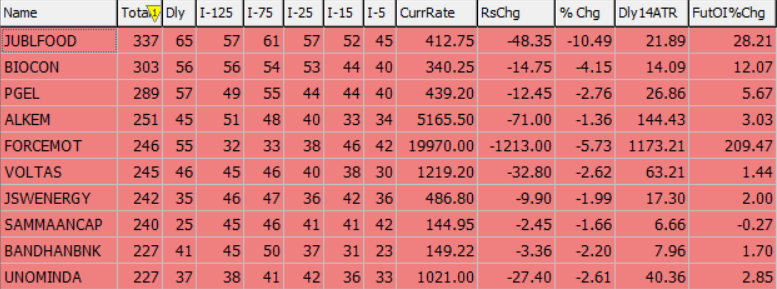
Worst Stocks of the day according to AI (Delta Dash)
Stock Prediction for 8th April 2026
| STOCK | Good Above | Weak Below |
| BAJFINANCE | 858 | 850 |
| CGPOWER | 696 | 690 |
| HAVELLS | 1240 | 1228 |
| TCS | 2550 | 2525 |
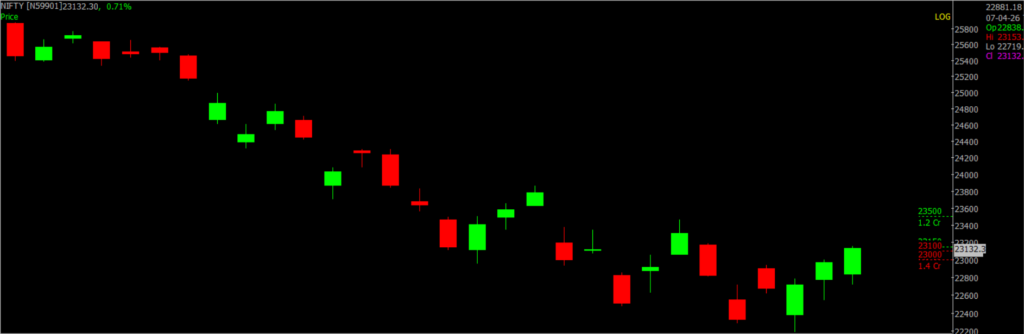
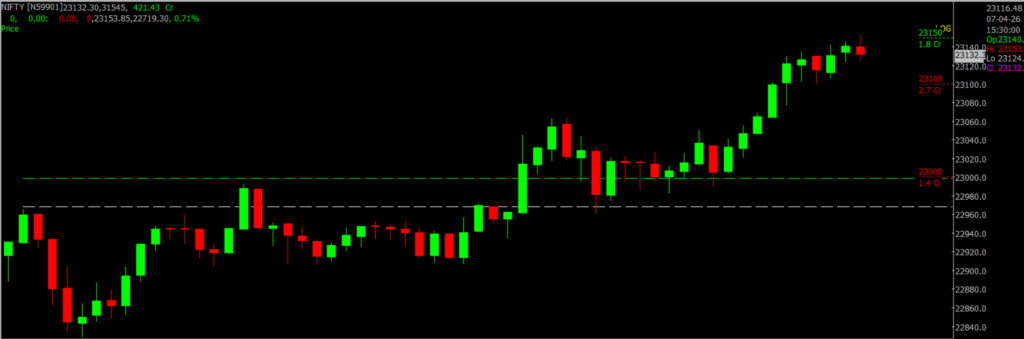
Prediction for Wednesday NIFTY can go up if it goes above 23,100 or down after the level of 22,800, but it also depends upon the Global cues.
NIFTY (23,124): NIFTY moved into a positive trend in the last trading session. Traders may consider going long with a stop-loss at 22,442 on a daily closing basis. The index is expected to remain strong as long as it holds above the 22,442 level.
Immediate support is placed in the 22,800–23,000 zone, while resistance is seen in the 23,100–23,500 range.
| Highest Call Writing at | 23,100 (1.2 Cr) |
| Highest Put Writing at | 22,800 (1.4 Cr) |
Nifty Support and Resistance
| Support | 22,800–23,000 |
| Resistance | 23,100–23,500 |
Bank Nifty Daily Chart Prediction
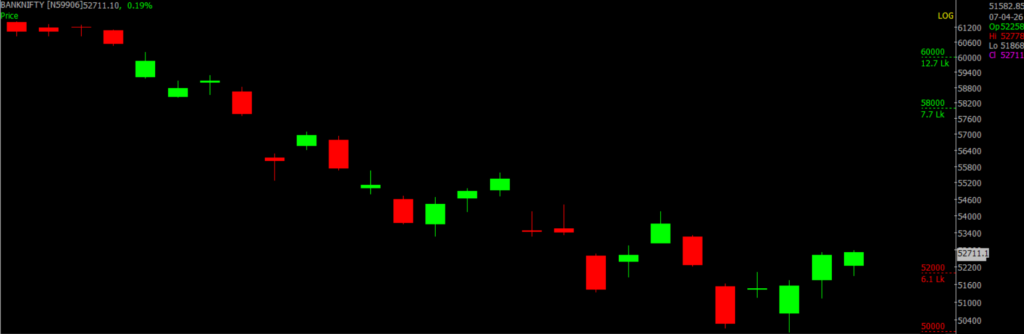
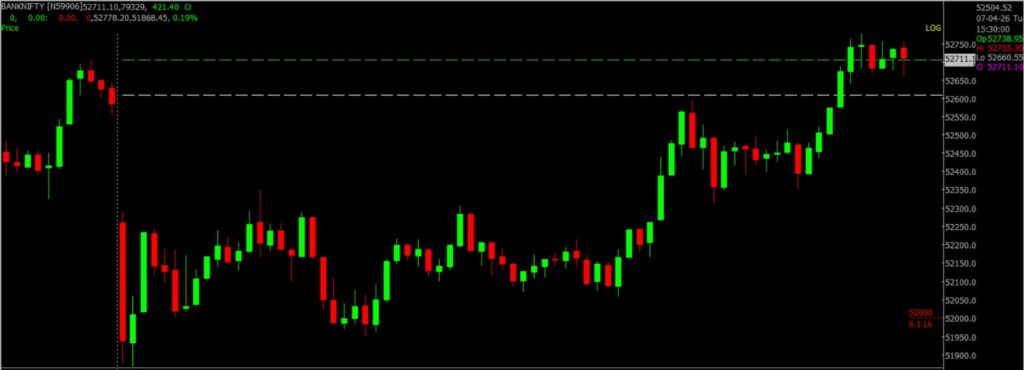
Prediction For Wednesday BANKNIFTY can go up if it goes above 52,700 or down after the level of 51,700, but it also depends upon the Global cues.
Bank Nifty ended with a marginal gain, forming a bullish candlestick on the daily chart, signaling buying interest near key support levels. On the hourly chart, the index has broken above its falling channel resistance and is holding above the 20 and 50 SMAs, indicating a short-term pullback.
With the RBI monetary policy decision approaching, volatility is expected to stay high. In the near term, the index could move towards the 54,000 mark, in line with its 20-day SMA. Immediate support is seen around 52,000–52,200 levels, while resistance lies in the 52,700–53,400 range. Broader support is placed between 51,700 and 51,000.
| Highest Call Writing at | 52,700 (6.1 Lk) |
| Highest Put Writing at | 51,700 (7.7 Lk) |
Bank Nifty Support and Resistance
| Support | 51,700 and 51,000 |
| Resistance | 52,700–53,400 |
Voice Of Traders by Spider Software
He Lost ₹45L… Then Built the 1-Min ‘Elephant Candle’ Strategy (Setup Revealed)… (Full Strategy Explained)

Disclaimer: The information provided in this Blog is for educational purposes only and should not be construed as financial advice. Trading in the stock market involves a significant level of risk and can result in both profits and losses. Spider Software & Team does not guarantee any specific outcome or profit from the use of the information provided in this Blog. It is the sole responsibility of the viewer to evaluate their own financial situation and to make their own decisions regarding any investments or trading strategies based on their individual financial goals, risk tolerance, and investment objectives. Spider Software & Team shall not be liable for any loss or damage, including without limitation any indirect, special, incidental or consequential loss or damage, arising from or in connection with the use of this blog or any information contained herein. ![]()