In this blog, we will learn how to identify reversal candlestick patterns, which are essential for effective technical analysis.
There’s a well-known saying in the stock market: “Bhav Bhagwan Hai,” which means that price movements are key. The best way to understand these price movements is by looking at candlestick charts. There are many candlestick patterns, some indicating bullish or bearish reversals, while others show trends continuing.
For retail traders and beginners, recognizing reversal candlestick patterns can offer a better safety margin. But how exactly does this work?
In this blog, we will go over how to trade reversal candlestick patterns. We will start with the basics of candlestick charts, ensuring you build a strong foundation for identifying and analyzing these patterns.
What are Reversal Candlestick Patterns?
A stock price can follow three main trends: upward, downward, or sideways. Reversal candlestick patterns help identify when a stock’s direction is about to change. This makes it easier to know when to enter or exit a trade based on potential price reversals.

How to Identify Reversal Candlestick Pattern?
Spotting reversal candlestick patterns can be challenging, time-consuming, and exhausting, especially when tracking all the stocks available in the market. With over 6,000 stocks listed on the NSE and BSE, analyzing each one across multiple time frames to find these patterns can be overwhelming for many traders.
Types of Reversal Candlestick Patterns
As mentioned earlier, reversal candlestick patterns can be divided into two main categories:
- Bullish Reversal Candlestick Patterns
- Bearish Reversal Candlestick Patterns
How to Trade Reversal Candlestick Patterns?
Trading reversal candlestick patterns can be straightforward. While each trader has their own style, here’s a simple method to get started, applicable to both bullish and bearish patterns.
1. Identify the Pattern
Once you see a reversal candlestick pattern on the chart, mark the high and low of that candle. If the pattern consists of multiple candles, mark the combined high and low.
2. Wait for Confirmation
Look for the next candle
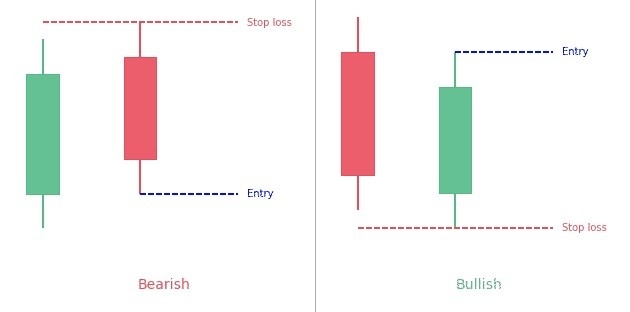
For a bullish reversal pattern, if the next candle is a green bullish candle that breaks above the high, you can enter a long position. Your initial target can be the distance between the pattern’s high and low, and your stop loss should be set at the low of the pattern. This gives you a risk-reward ratio of 1:1.
For a bearish reversal pattern, if the next candle is a bearish candle that drops below the low of the pattern, it signals weakness. You can then take a short position or sell if you already own the stock.
Top 5 Reversal Candlestick Pattern
1. Hammer
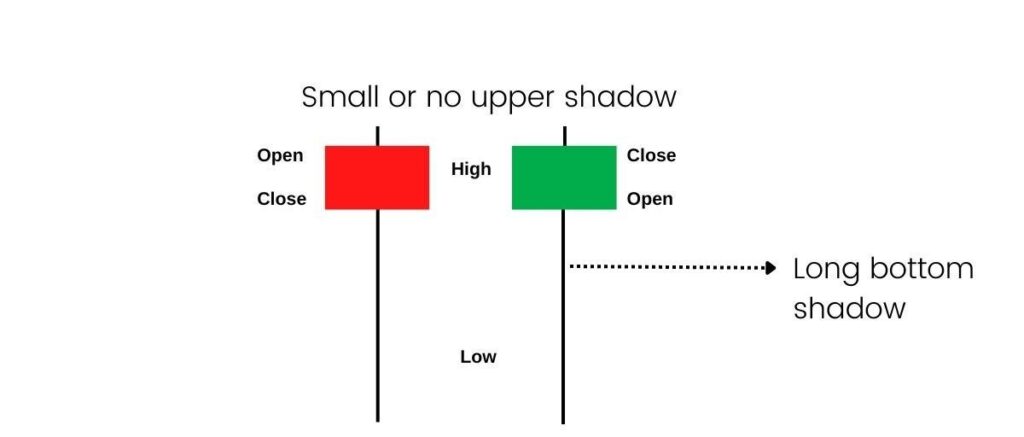
The hammer is a bullish reversal candlestick pattern that typically appears after a downtrend. It features a small real body with a long lower shadow that is at least twice the size of the body, and it has a small or almost nonexistent upper shadow. While the real body can be green or red, a green body suggests a stronger conviction for a price reversal.
Here’s an illustration of the bullish hammer candlestick pattern:
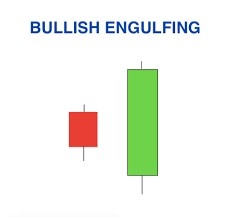
2. Bullish Engulfing
This reversal candlestick pattern consists of two candles. The first is a red candle, followed by a green candle that fully engulfs the body of the previous red candle.
Here’s an illustration of the bullish engulfing candlestick pattern:
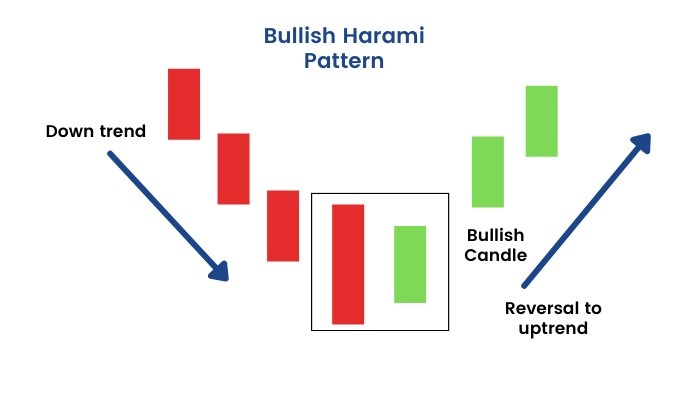
3. Bullish Harami
The term “Harami” in Japanese means pregnant. This pattern consists of two candles that show up after a downtrend. The first candle is a red bearish candle, followed by a small bullish green candle. In this pattern, the entire body and wicks of the green candle fit completely within the highs and lows of the previous red candle.
Here’s an illustration of the bullish harami candlestick pattern:
4. Piercing Line
The piercing line pattern consists of two candles. The first is a bearish candle that shows the stock is in a downtrend, while the second is a bullish green candle. This green candle must cover at least 50% of the body of the first candle, starting from below it.
Here’s an illustration of the piercing line candlestick pattern:
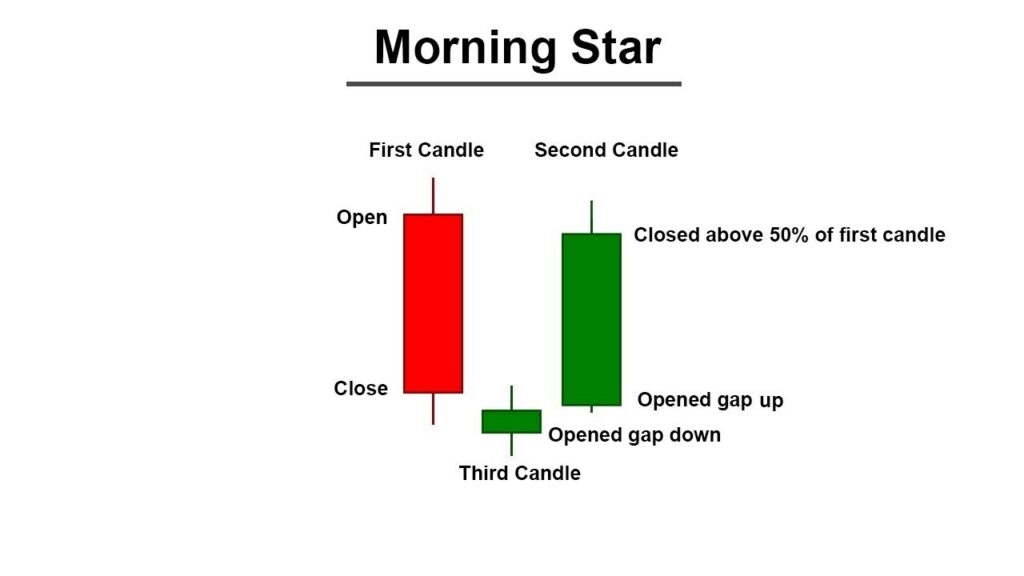
5. Morning Star
This pattern consists of three candles. The first candle is bearish, the second candle can be either green or red and forms after a gap down, with a small real body. The third candle, which is green, appears after a gap up and must cross 50% of the first candle’s body, signaling that the trend is about to reverse.
Here’s an illustration of the morning star candlestick pattern:
Power of Algorithms in Options Trading, Try Spider Now: Register Now
If you’d like to know how we analyze the market and provide accurate levels every day. then click on the Free Demo button below and change your trading life for good. 5X returns are possible in options trading If you have Spider Software in your trading system.
Disclaimer: The information provided in this Blog is for educational purposes only and should not be construed as financial advice. Trading in the stock market involves a significant level of risk and can result in both profits and losses. Spider Software & Team does not guarantee any specific outcome or profit from the use of the information provided in this Blog. It is the sole responsibility of the viewer to evaluate their own financial situation and to make their own decisions regarding any investments or trading strategies based on their individual financial goals, risk tolerance, and investment objectives. Spider Software & Team shall not be liable for any loss or damage, including without limitation any indirect, special, incidental or consequential loss or damage, arising from or in connection with the use of this blog or any information contained herein. ![]()