In Today’s Stock Market, Sensex ends marginally lower, Nifty holds above 23,250 after CAS; realty, pharma rise over 1.5%.
Stock Marspin maya casinoket Nifty Chart Prediction
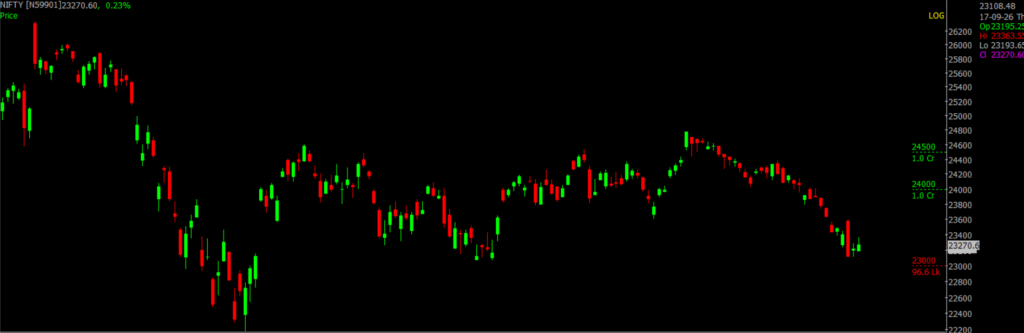
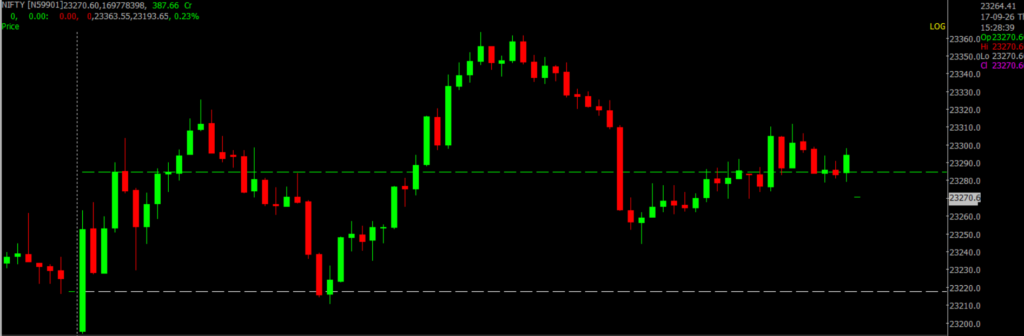
On Sept 17, Sensex was down 21.86 points at 74,314, and the Nifty was up 53.00 points at 23,270.
Top Nifty gainers : SBI Life Insurance, HDFC Life, ITC, Axis Bank and SBI
Top Nifty Losers: TCS, Wipro, Infosys, Tech Mahindra and Bajaj Finserv
The Closing Auction Session saw the Sensex adjust 99 points lower, from 74,414 at 3:15 pm to 74,315 at the post-CAS close. The Nifty moved 23 points lower, from 23,294 to 23,271, while Bank Nifty adjusted 81 points lower, from 56,137 to 56,056.
The Nifty Midcap 100 gained 0.92 percent and the Smallcap 100 rose 0.71 percent.
Best Stocks aviatorof the day according to AI (Delta Dash)
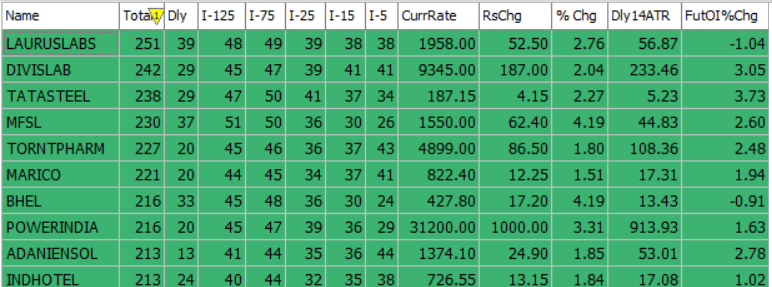
Worst Stocks of thteen pattie day according to AI (Delta Dash)
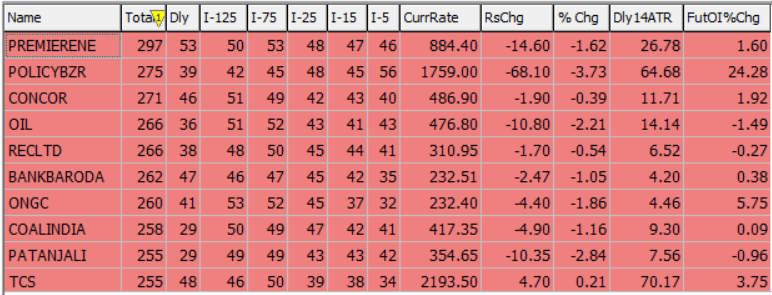
Stock Prediction for 18th September 2026
| STOCK | Good Above | Weak Below |
| DRREDDY | 1182 | 1168 |
| HAL | 4811 | 4761 |
| HDFCLIFE | 560 | 554 |
| OBEROIRLTY | 1750 | 1730 |
Prediction for Friday NIFTY can go up if it goes above 23,300 or down after the level of 23,000, but it also depends upon the Global cues.
Nifty continued to remain under pressure, with the index closing around 23,270, reflecting a cautious market sentiment. The chart shows a clear short-term downtrend, with selling pressure visible from higher levels. On the upside, 23,300–23,500 is the immediate resistance zone; a sustained move above this range could indicate some recovery. On the downside, 23,000–22,800 remains the key support zone, and holding this area will be important to prevent further weakness.
| Highest Call Writing at | 23,300 (96.6 lk) |
| Highest Put Writing at | 23,000 (1.0 cr) |
Nifty Support and Resistance
| Support | 23,000–22,800 |
| Resistance | 23,300–23,500 |
Bank Nifty Daily Chart Prediction
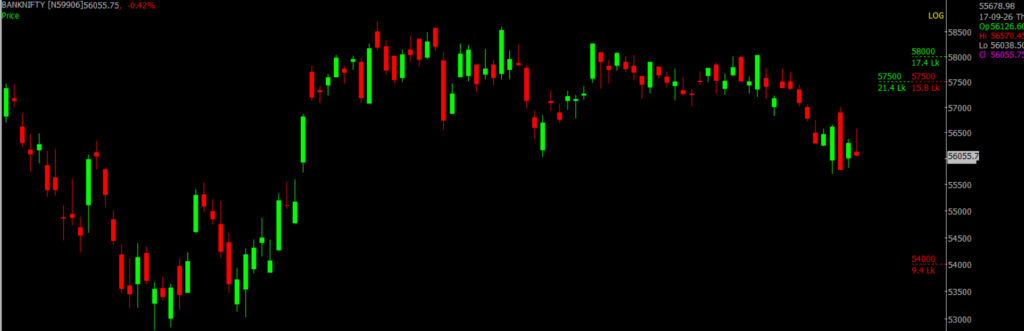
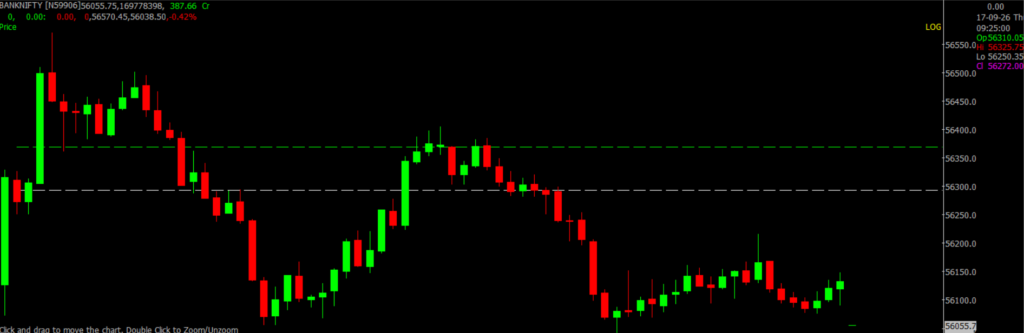
Prediction For Friday BANKNIFTY can go up if it goes above 56,000 or down after the level of 55,700, but it also depends upon the Global cues.
Bank Nifty remained under pressure, closing around 56,056, with the chart indicating a weak short-term trend and selling pressure at higher levels. The index is currently trading near the lower end of the recent range, making the 55,700–55,000 zone an important support area. On the upside, 56,000–56,500 is the immediate resistance zone. A sustained move above this range could bring some recovery, while a break below 55,700 may increase downside pressure.
| Highest Call Writing at | 56,000 (21.4 Lk) |
| Highest Put Writing at | 55,700 (15.8 Lk) |
Bank Nifty Support and Resistance
| Support | 55,700–55,000 |
| Resistance | 56,000–56,500 |
Disclaimer: The information provided in this Blog is for educational purposes only and should not be construed as financial advice. Trading in the stock market involves a significant level of risk and can result in both profits and losses. Spider Software & Team does not guarantee any specific outcome or profit from the use of the information provided in this Blog. It is the sole responsibility of the viewer to evaluate their own financial situation and to make their own decisions regarding any investments or trading strategies based on their individual financial goals, risk tolerance, and investment objectives. Spider Software & Team shall not be liable for any loss or damage, including without limitation any indirect, special, incidental or consequential loss or damage, arising from or in connection with the use of this blog or any information contained herein.