
In the Stock Market Today, Nifty slides below 22,500, Sensex plunges 733 points; metals steal the spotlight.
Stock Market Nifty Chart Prediction.
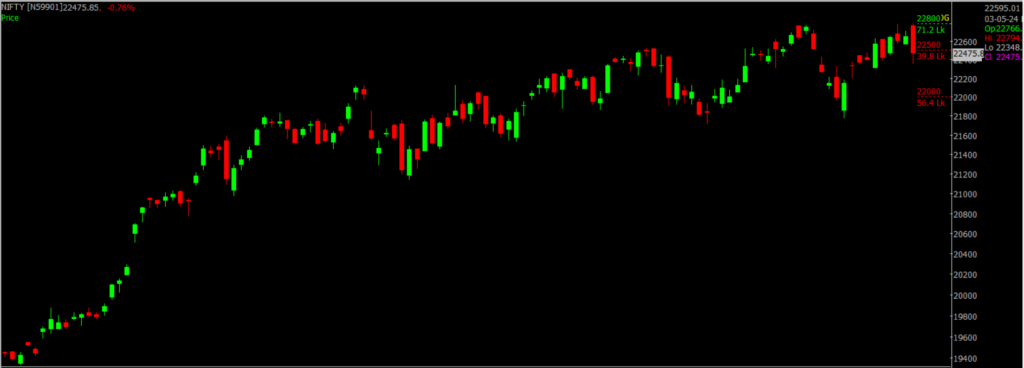
On April 03, Sensex dropped by 732.96 points at 73,878.15, while the Nifty fell by 172.35 points, at 22,475.80. Advancing shares numbered 1,241, declining shares were -2,013, and 79 remained unchanged.
Top Nifty gainers: L&T, Maruti Suzuki, Reliance Industries, Nestle India and Bharti Airtel,
Top Nifty Losers: Coal India, Grasim Industries, ONGC, Dr Reddy’s Laboratories and Hindalco Industries.
Except for the metal sector, all other sectoral indices closed in negative territory. Capital goods, realty, telecom, & PSU Bank each witnessed a decline of 1%, while oil & gas, auto, Information Technology, and Media sectors all experienced a 0.5% drop.
BSE midcap index fell 0.2% and smallcap index down 0.5%.
Stock Prediction for 06th May 2024.
| STOCK | Good Above | Weak Below |
| CIPLA | 1432 | 1410 |
| CONCOR | 1065 | 1054 |
| GODREJCP | 1260 | 1242 |
| HINDALCO | 650 | 643 |
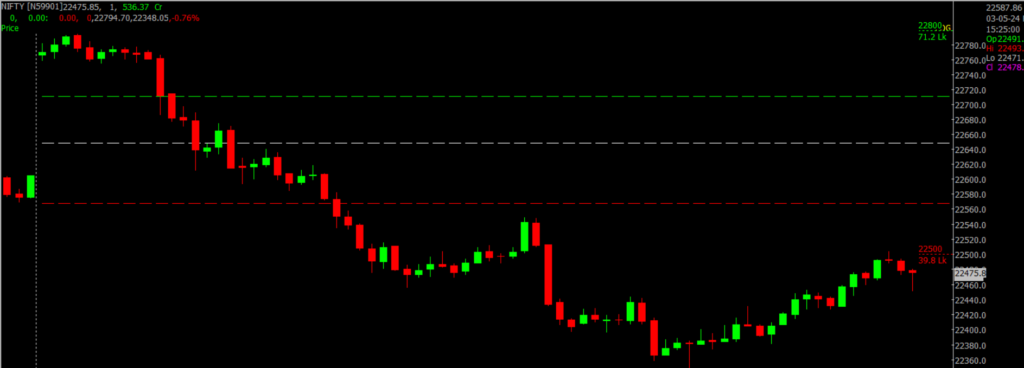
Prediction For Monday, NIFTY can go up if it goes above 22,800 or down after the level of 22,500 but all depends upon the Global cues.
Nifty experienced significant volatility today, ending with a nearly one percent loss. Despite starting strong on global cues, profit-taking in heavyweight stocks wiped out early gains, pushing the index into negative territory. This sharp drop nullified gains from the past four sessions. We suggest caution and hedged positions if the Nifty drops below 22,400. It’s important to watch the US markets closely for guidance. Resistance is at 22,800-22,900, and support is at 22,500-22,300.
| Highest Call Writing at | 22,800 (17.2 Lakhs) |
| Highest Put Writing at | 22,500 (39.8 Lakhs) |
Nifty Support and Resistance
| Support | 22,500, 22,300 |
| Resistance | 22,800, 22,900 |
Bank Nifty Daily Chart Prediction.
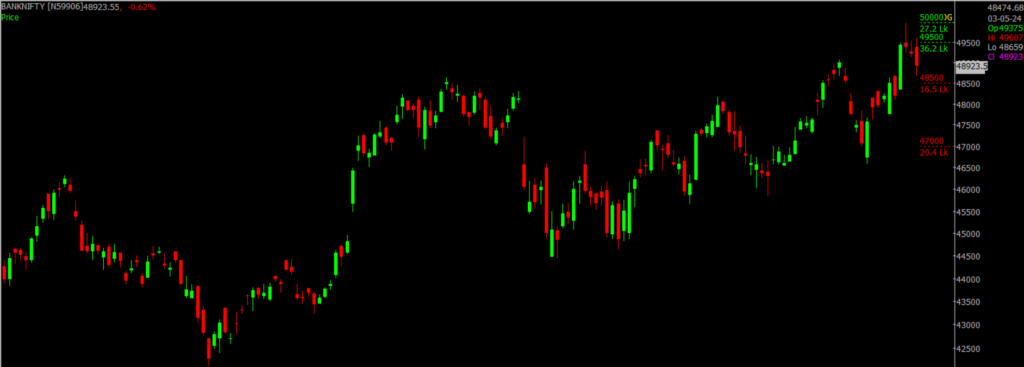
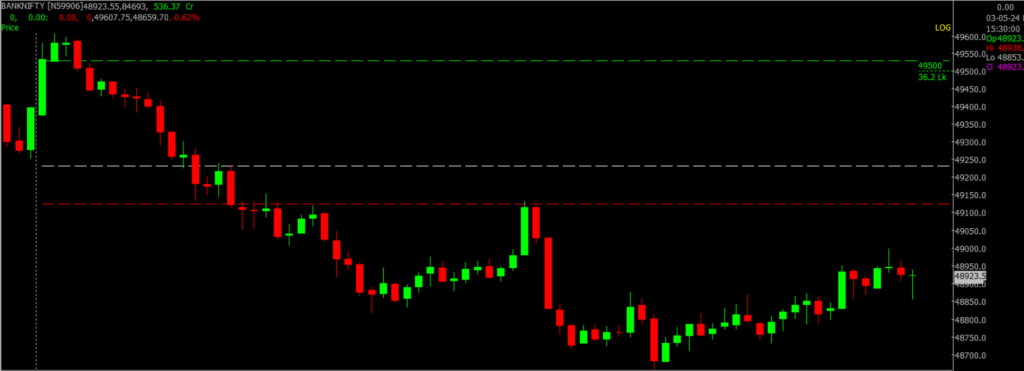
Prediction For Monday, Bank NIFTY can go up if it goes above 49,500 or down after the level of 48,500 but it all depends upon the Global cues.
BankNifty exhibited a reversal at the upper boundary of the ascending channel, indicated by the presence of a Shooting Star candlestick pattern, hinting at a potential correction. Meanwhile, the Auto and Metal sectors are adhering to anticipated trajectories, reinforcing our bullish stance. Key support levels are identified at 48,500-48,000, while resistance levels are noted at 49,500-50,000.
| Highest Call Writing at | 49,500 (36.2 Lakhs) |
| Highest Put Writing at | 48,500 (16.5 Lakhs) |
Bank Nifty Support and Resistance
| Support | 48,500, 48,000 |
| Resistance | 49,500, 50,000 |
Click here to learn the Stocks to Watch as Tensions Between Israel and Iran Escalates.
New Options Trading Software by Spider is here, Try GChart demo for free. Register Now
If you’d like to know how we analyze the market and provide accurate levels every day. then click on the Free Demo button below and change your trading life for good. 5X returns are possible in options trading If you have Spider Software in your trading system.
Disclaimer: The information provided in this Blog is for educational purposes only and should not be construed as financial advice. Trading in the stock market involves a significant level of risk and can result in both profits and losses. Spider Software & Team does not guarantee any specific outcome or profit from the use of the information provided in this Blog. It is the sole responsibility of the viewer to evaluate their own financial situation and to make their own decisions regarding any investments or trading strategies based on their individual financial goals, risk tolerance, and investment objectives. Spider Software & Team shall not be liable for any loss or damage, including without limitation any indirect, special, incidental or consequential loss or damage, arising from or in connection with the use of this blog or any information contained herein.