In today’s stock market, Nifty slips below 24,000; Sensex falls 310 points as auto and banking stocks weigh, while metal and pharma advance.
Stock Marspin maya casinoket Nifty Chart Prediction
On June 29, the Sensex was down 372.10 points at 76,728.37, and the Nifty was down 109.75 points at 23,946.25. About 1,681 shares advanced, 2,471 shares declined, and 202 shares remained unchanged.
Top Nifty gainers : Kotak Mahindra Bank, M&M, Tata Motors Passenger Vehicles, Adani Enterprises, Interglobe Aviation
Top Nifty Losers : Max Healthcare, Coal India, Dr Reddy’s Laboratories, Eternal and Trent
Among sectors, Auto index shed 2%, while PSU Bank, Media, IT, Oil & Gas down 1-1.5%. On the other hand, Metal, Pharma, Healthcare up 0.8% each.
The Nifty midcap index slipped 0.2 percent and smallcap index fell 0.6 percent.
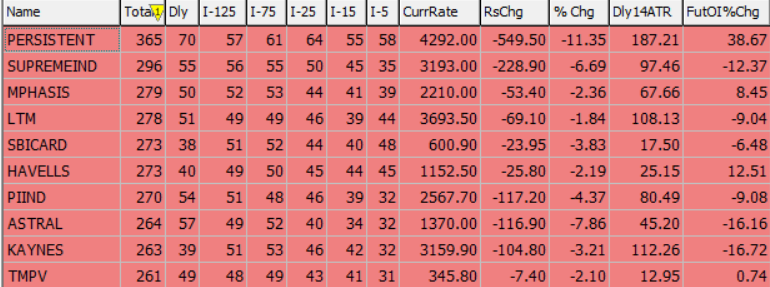
Best Stocks aviatorof the day according to AI (Delta Dash)
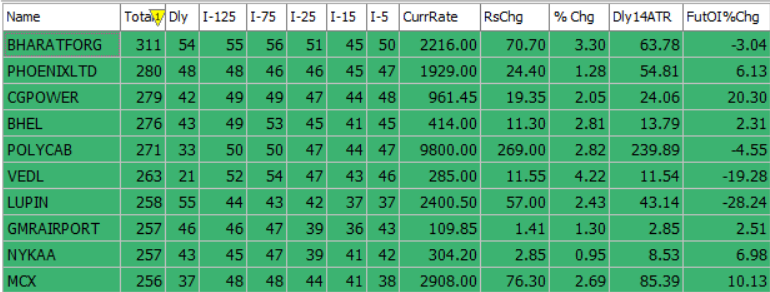
Worst Stocks of thteen pattie day according to AI (Delta Dash)
Stock Prediction for 30th June 2026
| STOCK | Good Above | Weak Below |
| BHEL | 417 | 412 |
| COALINDIA | 445 | 440 |
| JSWENERGY | 586 | 580 |
| MAXHEALTH | 1156 | 1140 |
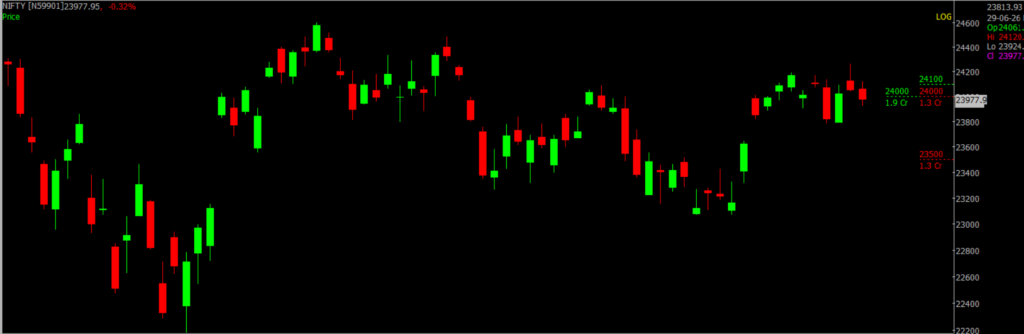
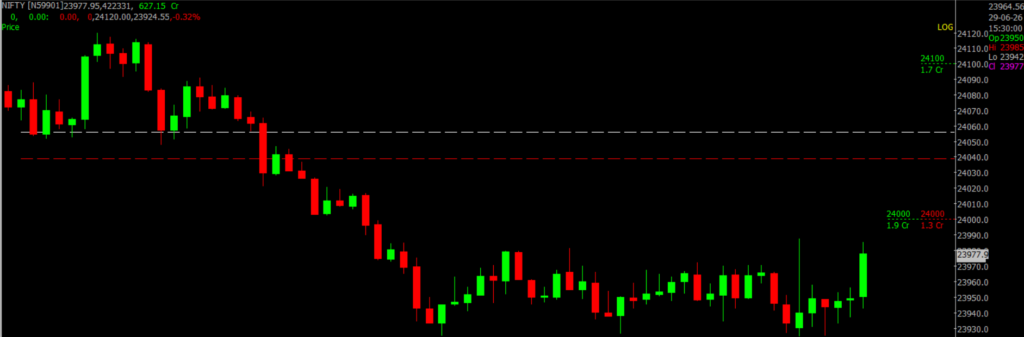
Prediction for Tuesday NIFTY can go up if it goes above 24,000 or down after the level of 23,900, but it also depends upon the Global cues.
NIFTY is currently trading in a consolidation phase, with the index moving between key support and resistance levels. The 24,000–24,500 zone remains a strong resistance area where selling pressure has been visible, making it difficult for the index to sustain higher levels. On the downside, 23,900–23,500 acts as a crucial support zone, where buyers are expected to step in and provide stability. As long as NIFTY holds above 23,500, the overall short-term trend remains positive, although range-bound movement may continue. A decisive breakout above 24,500 could trigger fresh buying momentum and open the path toward higher levels, while a breakdown below 23,500 may invite further selling pressure and lead to a deeper correction. Traders should closely monitor these key zones, as the next directional move is likely to be determined by a strong breakout or breakdown accompanied by healthy trading volumes.
| Highest Call Writing at | 24,000 (1.9 Cr) |
| Highest Put Writing at | 23,900 (1.9 Cr) |
Nifty Support and Resistance
| Support | 23,900–23,500 |
| Resistance | 24,000–24,500 |
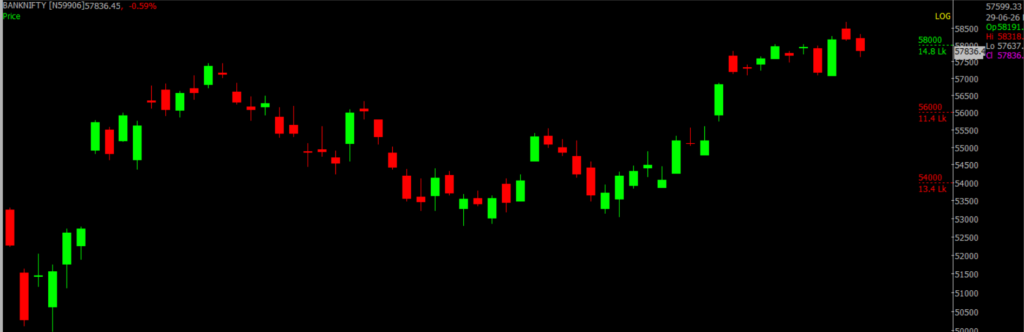
Bank Nifty Daily Chart Prediction
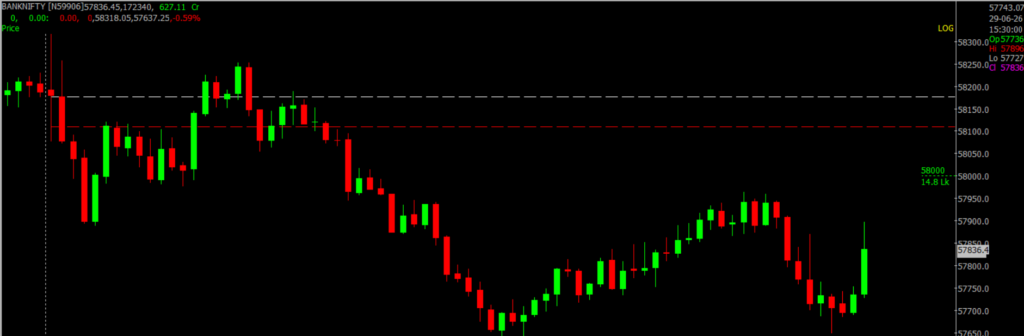
Prediction For Tuesday BANKNIFTY can go up if it goes above 58,300 or down after the level of 57,600, but it also depends upon the Global cues.
BANK NIFTY is currently trading near a crucial zone after witnessing a strong recovery from lower levels. The index is facing immediate resistance in the 58,300–58,800 range, where profit booking and selling pressure may emerge. A sustained move above 58,800 with strong buying volume could confirm a fresh bullish breakout and open the door for further upside. On the downside, 57,600–57,000 remains a key support zone, where buyers are expected to defend the trend. As long as BANK NIFTY holds above 57,000, the broader short-term outlook remains positive despite minor pullbacks. However, a decisive breakdown below this support zone could weaken market sentiment and trigger additional selling pressure. Traders should closely monitor these support and resistance levels, as a confirmed breakout or breakdown is likely to determine the index’s next significant move.
| Highest Call Writing at | 58,300 (16.1 Lk) |
| Highest Put Writing at | 57,600 (11.4 Lk) |
Bank Nifty Support and Resistance
| Support | 57,600–57,000 |
| Resistance | 58,300–58,800 |
Voice Of Traders by Spider Software
He Lost ₹45L… Then Built the 1-Min ‘Elephant Candle’ Strategy (Setup Revealed)… (Full Strategy Explained)

Disclaimer: The information provided in this Blog is for educational purposes only and should not be construed as financial advice. Trading in the stock market involves a significant level of risk and can result in both profits and losses. Spider Software & Team does not guarantee any specific outcome or profit from the use of the information provided in this Blog. It is the sole responsibility of the viewer to evaluate their own financial situation and to make their own decisions regarding any investments or trading strategies based on their individual financial goals, risk tolerance, and investment objectives. Spider Software & Team shall not be liable for any loss or damage, including without limitation any indirect, special, incidental or consequential loss or damage, arising from or in connection with the use of this blog or any information contained herein. ![]()