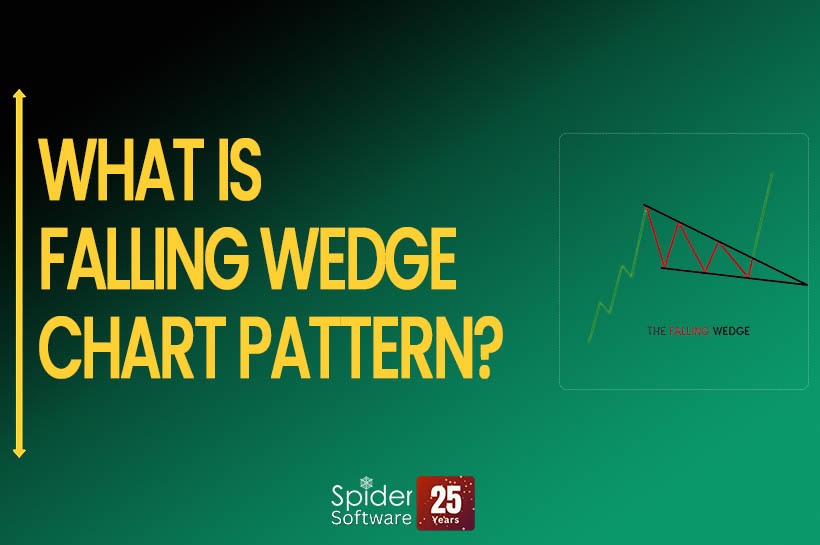
A falling wedge is a pattern where the price moves between narrowing downward lines, often signaling a continued upward trend.
Candlestick charts are a widely used tool for analyzing an asset’s price. By examining these charts, traders can spot patterns that may hint at future price movements. One key pattern is the falling wedge, which can be a powerful signal of where the price might be headed next.

The wedge pattern is often seen as a reversal signal, though it can sometimes point to a trend continuing.
A falling wedge is a bullish reversal pattern formed by two downward-sloping, converging trend lines. It typically appears during an uptrend when momentum temporarily slows. Once the price breaks out of the wedge, it usually signals a continuation of the upward move.
FEATURES OF FALLING WEDGE
The falling wedge is a useful pattern to spot potential reversals or trend continuation. It usually appears during an uptrend when the price pulls back slightly.
Here are its main features:
- Temporary Downtrend: After moving up, the price dips, forming lower highs and lower lows.
- Converging Trend Lines: Two downward-sloping lines get closer as the price range tightens.
- Lower Volume: Trading volume drops as the pattern forms.
This pattern shows that sellers are losing strength. Once the price breaks above the top trend line, it often signals the end of the pullback and a return to the uptrend.
IMPORTANCE OF FALLING WEDGE
Knowing how to spot a falling wedge pattern is useful because:
- It signals the end of a pause or pullback in price. When the price breaks above the top trend line, it often moves higher, continuing the uptrend.
- Traders can use this pattern to enter new trades or add to existing positions. It also helps identify smart entry and exit points.
When Does a Falling Wedge Pattern Form?
A falling wedge usually forms during a downtrend and shows that selling pressure is weakening. Here’s how it develops:
1. Existing Downtrend:
The price is moving lower, with sellers in control.
2. Converging Trendlines:
Two lines form—a steeper upper line (resistance) and a gentler lower line (support)—that come closer together.
3. Lower Highs and Lower Lows:
The price keeps making lower highs and lower lows, but the drop is slowing down.
4. Decreasing Volume:
Trading volume falls as the price range tightens, indicating less selling pressure.
5. Price Contraction:
The price range keeps shrinking until a breakout happens.
EXAMPLE
To identify a falling wedge pattern during a downtrend, look for the following key signs on a chart:

The chart above shows an example of a falling wedge pattern forming during a downtrend.
Entry Signal:
Place a long (buy) order once the price breaks above the upper trendline of the wedge.
Breakout Confirmation Tip:
Don’t rush in. Wait for a full candle to close above the upper trendline to confirm the breakout and avoid false signals.
The chart below highlights the entry point and the exact area where price breaks the wedge, signaling a bullish reversal.

1. Long Buy Entry
Enter a long (buy) position when the price breaks above the upper trendline of the wedge.
2. Stop-Loss Placement
Set your stop-loss just below the lower trendline of the wedge to manage risk and avoid unexpected losses.
3. Profit Target
- Measure the height of the back (rear) of the wedge, this is the distance between the highest high and lowest low at the start of the pattern (Point 2).
- From the breakout point, project that same distance upward to set your target level (Point 3).
4. Target Calculation
- Entry to Target Distance = Height of the rear of the wedge (Point 2).
- Take-Profit (Point 3) lies exactly that far above your entry.
CONCLUSION
The Falling Wedge is a bullish pattern that often signals a price move upward. Although the pattern slopes downward, it usually indicates a trend reversal or continuation, showing a key turning point for traders. This pattern can take months to form and ends with a strong breakout above the upper resistance line, often accompanied by a rise in trading volume.
The Falling Wedge is a useful tool for spotting potential bullish moves, but because it can be complex, it’s important to understand it well before using it in real trades.
Power of Algorithms in Options Trading, Try Spider Now: Register Now
If you’d like to know how we analyze the market and provide accurate levels every day. then click on the Free Demo button below and change your trading life for good. 5X returns are possible in options trading If you have Spider Software in your trading system.
Disclaimer: The information provided in this Blog is for educational purposes only and should not be construed as financial advice. Trading in the stock market involves a significant level of risk and can result in both profits and losses. Spider Software & Team does not guarantee any specific outcome or profit from the use of the information provided in this Blog. It is the sole responsibility of the viewer to evaluate their own financial situation and to make their own decisions regarding any investments or trading strategies based on their individual financial goals, risk tolerance, and investment objectives. Spider Software & Team shall not be liable for any loss or damage, including without limitation any indirect, special, incidental or consequential loss or damage, arising from or in connection with the use of this blog or any information contained herein. ![]()