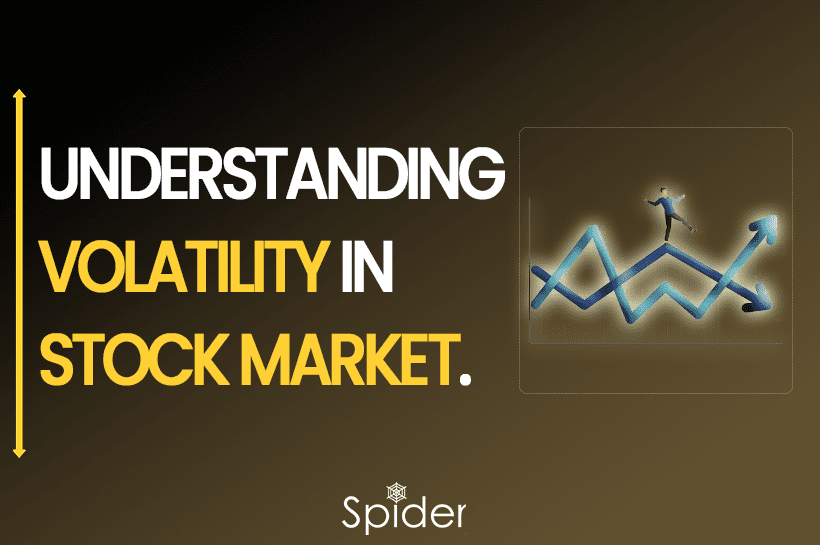
Volatility is the measure of how much a stock’s price fluctuates over time, indicating its potential risk and uncertainty.
What is a Volatility in Stock Market?

Stock market volatility is a way of measuring how much the value of the stock market, or individual stocks, goes up and down over time. It shows how much prices can change from their average value. Investors or Traders calculate VIX using a statistical measure called standard deviation. When the stock market experiences high VIX Index, prices fluctuate a lot, and there is uncertainty and risk in the market. On the other hand, low Index indicates a more stable market with smaller price swings. Investors and traders closely monitor fear index (VIX) as it can affect their investment decisions and strategies.
Analyzing Volatility
Volatility in the stock market refers to how much the value of a security, like a stock, can change over time. If a stock has high VIX, its price can go up and down a lot. On the other hand, if a stock has low VIX, its price tends to be more stable.
To analyze or measure volatility, we look at the daily percentage change in a stock’s price. Historical volatility tells us how much the stock’s price has varied in the past. It’s expressed as a percentage.
Variance measures how much a stock’s returns differ from its average value. Volatility is a type of variance that focuses on price changes over specific periods like daily, weekly, monthly, or yearly. It’s like an annual summary of variance.
In simple terms, volatility shows how uncertain or risky a stock’s price movements can be. High volatility means big price swings, while low volatility means the price stays more consistent.
Calculating Volatility
Volatility in the stock market is calculated by measuring the fluctuations or changes in the stock’s price over a specific period. The most commonly used method to calculate volatility is by using the standard deviation of the stock’s daily returns. Here’s a step-by-step explanation of how it works:
Gather Data: Collect the daily closing prices of the stock for a certain period, let’s say 30 days.
Calculate Daily Returns: Calculate the daily returns for each day by dividing the difference between the current day’s closing price and the previous day’s closing price by the previous day’s closing price. For example: Day 1: Closing Price = Rs. 100, Previous Day’s Closing Price = Rs. 95 Daily Return = (100 – 95) / 95 = 0.0526 or 5.26%
Average Daily Return Measurement: Add up all the daily returns and divide by the number of days to get the average daily return.
Calculate Variance: For each day, subtract the average daily return from the actual daily return, square the result, and sum up all the squared differences.
Calculate Volatility: Divide the total variance by the number of days and take the square root to get the volatility.
For example, let’s say we have the following closing prices for ABC stock over the past 5 days: Day 1: Rs. 100 Day 2: Rs. 102 Day 3: Rs. 98 Day 4: Rs. 101 Day 5: Rs. 99
Evaluate Daily Returns Day 1: (102 – 100) / 100 = 0.02 or 2% Day 2: (98 – 102) / 102 = -0.039 or -3.9% Day 3: (101 – 98) / 98 = 0.0306 or 3.06% Day 4: (99 – 101) / 101 = -0.0198 or -1.98% Day 5: (99 – 99) / 99 = 0
Average Daily Return Calculation (2 – 3.9 + 3.06 – 1.98 + 0) / 5 = 0.0362 or 3.62%
Calculate Variance [(0.02 – 0.0362)^2 + (-0.039 – 0.0362)^2 + (0.0306 – 0.0362)^2 + (-0.0198 – 0.0362)^2 + (0 – 0.0362)^2] / 5 = 0.00047072
Volatility Square root of 0.00047072 = 0.0217 or 2.17%
So, the volatility of ABC stock over the past 5 days is approximately 2.17%.
Different types of Volatility
In the stock market, volatility refers to how much the prices of stocks or the overall market change over time. There are two main types of volatility:
Historical Volatility:
This looks at past price movements of a stock or the market. It helps us understand how much the stock’s price has gone up and down in the past. For example, if a stock has experienced big price swings in the last month, it has high historical fear index.
Implied Volatility:
This is more about the future and what investors or traders think might happen to the stock’s price. It comes from the prices of options on the stock. If the options prices show that traders expect big price swings in the future, it means there is high implied volatility.
For instance, if a company is about to release its earnings report, and the options prices suggest that traders are expecting a significant move in the stock’s price, it indicates high implied volatility. On the other hand, if the options prices indicate little change in the stock’s price, it means there is low implied volatility.
The Relation between Volatility and Options

The relationship between volatility and options is crucial in the world of trading. Volatility refers to the degree of price fluctuation in the market, and it plays a significant role in determining the prices of options.
When the market experiences high volatility, options prices tend to increase because there is a higher chance of significant price swings, leading to potentially larger profits. Traders find options more attractive during such periods, as they offer opportunities for higher gains.
On the other hand, when the market experiences low volatility, options prices decrease because there is a lower likelihood of significant price movements. In such scenarios, options may not be as appealing for traders, as they may result in smaller profits.
Overall, traders use volatility as a critical factor in making trading decisions and developing specific strategies based on the market’s current conditions. By understanding the relationship between volatility and options, traders can navigate the market more effectively and make informed trading choices.
How Traders Understand the Index (VIX)?
VIX, also known as the Volatile Index, is a widely used measure of market volatility. It is often called the “fear gauge” because it reflects investor sentiment and expectations for future market VIX Index.
When the VIX is in the red or at a low level, it suggests that investors are relatively calm, and there is a low anticipated market volatile. This typically occurs during stable market conditions when investors feel more confident and expect minimal price fluctuations. It indicates a more stable and predictable market environment.
On the other hand, when the VIX is in the green or at a high level, it indicates that investors are nervous and expect higher volatile market. This usually happens during periods of uncertainty or economic instability when investors are concerned about potential market declines or unpredictable price movements. A high VIX value reflects increased fear and uncertainty in the market.
Therefore, the VIX provides important insights into market sentiment and expectations for future volatility. When it’s in the red, it signifies a calm market, while when it’s in the green, it signifies heightened fear and uncertainty among investors.
To Sum Up
Volatility in the stock market refers to the extent of price fluctuations. High VIX means prices change rapidly, indicating uncertainty, while low VIX implies more stable prices. The VIXmeasures market expectations of volatile future, known as the “fear gauge.” A rising VIX (in red) signifies higher uncertainty while a falling VIX (in green) suggests a calmer market. Both volatility and VIX are essential in making investments as well as trading decisions and managing risks for traders and investors.
Learn how utilizing the Momentum Strategy can boost your intra-day trading skills and elevate your trading abilities. Click Here To Register

Also, if you want to how Triple Top Pattern is formed in the Stock Market? Click Here To Know
Disclaimer: The information provided in this Blog is for educational purposes only and should not be construed as financial advice. Trading in the stock market involves a significant level of risk and can result in both profits and losses. Spider Software & Team does not guarantee any specific outcome or profit from the use of the information provided in this Blog. It is the sole responsibility of the viewer to evaluate their own financial situation and to make their own decisions regarding any investments or trading strategies based on their individual financial goals, risk tolerance, and investment objectives. Spider Software & Team shall not be liable for any loss or damage, including without limitation any indirect, special, incidental or consequential loss or damage, arising from or in connection with the use of this blog or any information contained herein.


