The Super Trend Indicator is a widely-used tool or indicator in financial markets that helps traders identify trends and trend reversals.
What is Super Trend Indicator ?
The Super Trend Indicator plots a line above or below the price chart to indicate the trend direction and includes a stop-loss level to restrict potential losses. Traders can calculate the indicator using different methods and validate trading signals by combining it with other indicators. However, traders should note that like all technical indicators, they need to use it with other analysis techniques to make informed trading decisions.
How does Super Trend Indicator works?
To calculate the Super Trend Indicator, traders use the closing price of an asset and the Average True Range (ATR), which measures volatility. The resulting value is plotted above or below the price chart to indicate the trend direction, and the ATR helps determine the distance between the Super Trend line and the price.
If the Super Trend line is above the price chart, traders may consider selling or shorting the asset as it suggests a downtrend. Conversely, if the Super Trend line is below the price chart, traders may consider buying or going long on the asset as it suggests an uptrend. The Super Trend Indicator also features a stop-loss level to limit potential losses if the trend reverses.
When the price crosses the Super Trend line, it signals a potential change in trend direction, and traders may exit the position or take a profit. It’s crucial to note that traders should not rely solely on the Super Trend Indicator and should use it in combination with other analysis techniques. Additionally, traders should consider external factors that may impact the asset’s price movement, such as market conditions, news events, and other factors.
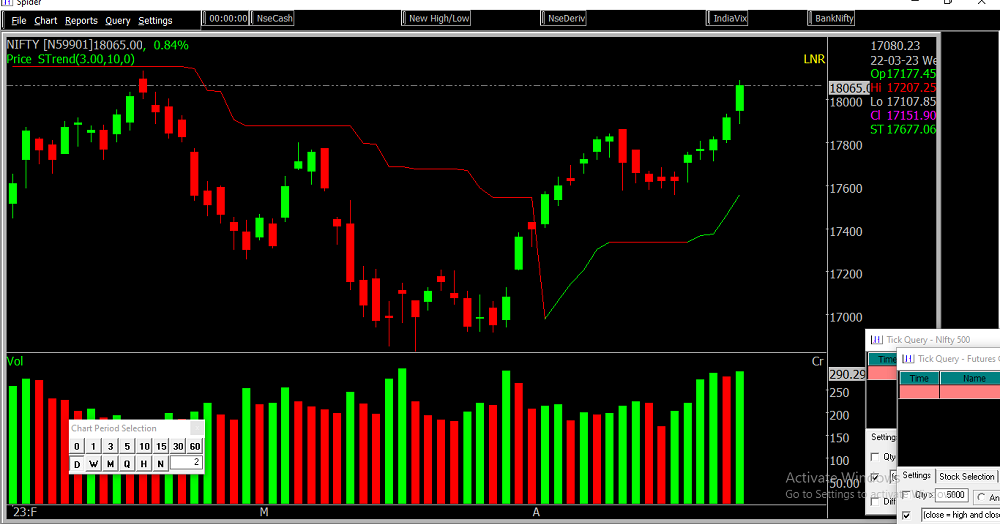
How to use Super Trend Indicator in Spider Software?
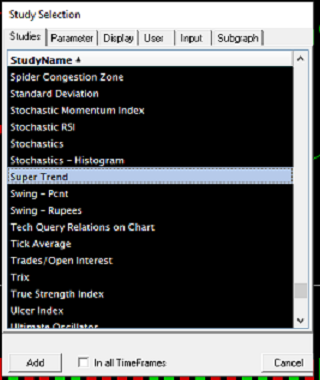
Press S -> Select Parametres -> Apple -> OK
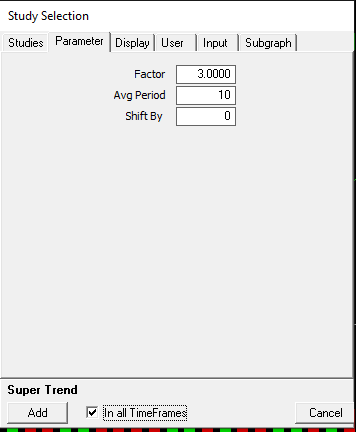
Parameters for Super Trend Indicator (3, 10)
Conclusion:
To sum up, the Super Trend Indicator is an effective technical analysis tool for traders seeking to identify trends and potential trend reversals in financial markets. It’s calculated using the closing price and Average True Range (ATR) to plot a line above or below the price chart, indicating the trend direction. Traders can utilize the Super Trend line and stop-loss level to make informed trading decisions and limit potential losses. However, it’s important to use the indicator alongside other analysis techniques and consider external factors that may impact the asset’s price movement.
Disclaimer: The information provided in this Blog is for educational purposes only and should not be construed as financial advice. Trading in the stock market involves a significant level of risk and can result in both profits and losses. Spider Software & Team does not guarantee any specific outcome or profit from the use of the information provided in this Blog. It is the sole responsibility of the viewer to evaluate their own financial situation and to make their own decisions regarding any investments or trading strategies based on their individual financial goals, risk tolerance, and investment objectives. Spider Software & Team shall not be liable for any loss or damage, including without limitation any indirect, special, incidental or consequential loss or damage, arising from or in connection with the use of this blog or any information contained herein. ![]()