Swing trading, a widely used strategy, aims to seize short- to medium-term market price shifts. It’s chasing quick gains with low risk. Using technical analysis tools, swing traders pinpoint potential trading opportunities. This article dives into what swing trading involves and highlights the indicators commonly employed by traders.
How does Swing Trading work?

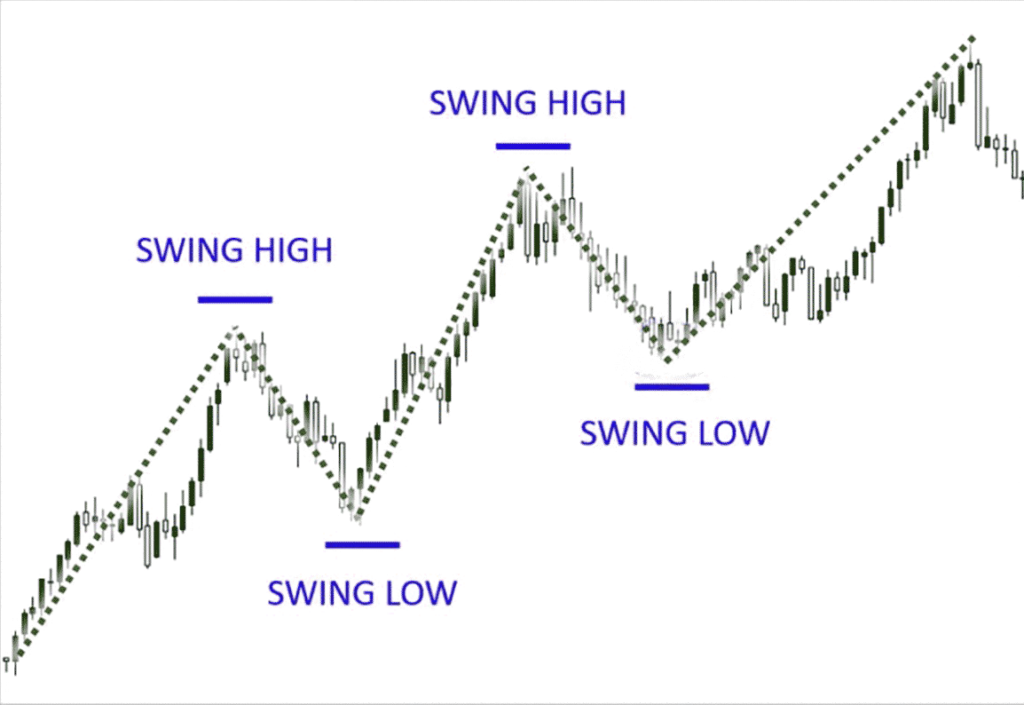
Swing trading involves holding positions for days or weeks, depending on market trends. Traders use technical analysis to identify patterns and decide when to buy or sell based on expected price trends. They look for swing highs and lows to recognize market trends, aiming for positive risk-return ratios and capitalizing on volatility. This strategy combines chart patterns, market sentiment, and technical indicators to predict price changes. Swing traders use technical analysis to find stocks with potential strong moves soon. They buy at the swing low, anticipating a rise, and sell at the swing high to take gains. If the stock slumps, they may sell early to limit losses. The main goal is capturing high-momentum stock movements by analyzing trends and fluctuations.
Indicators that can help with Swing Trading.
1. Moving Averages:
Traders often rely on moving averages to understand a stock’s trend and momentum. This involves averaging stock prices over a specific time, and the results are shown on charts as lines or bars. Examining moving averages across different time frames helps traders identify converging trends or predict upcoming market shifts.
2. Volume:
High trading volume is crucial for swing traders, indicating a higher chance of price changes. A spike in trading volume suggests an imminent price breakout. On the flip side, low trading volume may lead swing traders to focus on stocks with higher trade activity.
3. Stochastic Oscillator:
This oscillator is a favorite among swing traders for identifying overbought or oversold stock levels. It uses a scale from zero to 100 to assess a stock’s strength or weakness based on its current price.
4. Relative Strength Index (RSI):
The RSI is a technical tool used to analyze a stock. It pinpoints potential price changes, using a scale from zero to 100 to show a stock’s strength.
5. Bollinger Bands:
Bollinger bands consist of a moving average and two lines indicating standard deviation above and below it. These bands help traders spot volatility and potential price reversals when prices move beyond the bands.
6. Fibonacci Retracements:
Fibonacci retracement levels are horizontal lines showing potential support and resistance based on the Fibonacci sequence. Traders use these levels to find possible entry and exit points.
7. Support and Resistance:
Although not strictly a technical indicator, support and resistance levels are crucial price points for a stock. Support levels indicate a point where the price is unlikely to fall below, while resistance levels show points where the price is unlikely to go above. Swing traders often focus on trading around these levels, as they often signal market turning points.
8. Moving Average Convergence Divergence:
The MACD (Moving Average Convergence Divergence) is a valuable tool for understanding a stock’s trend. It compares short-term (12 days) and long-term (26 days) moving averages, with the MACD line representing the difference between them. This line oscillates above and below a zero line, signaling trends. A positive MACD indicates an upward or bullish trend, while a negative MACD suggests a downward or bearish trend. In summary, MACD assists traders in assessing a stock’s trend strength, direction, momentum, and duration.
Bottom Line:
Swing trading is about seizing short- to medium-term market movements for quick gains with low risk. Traders use indicators like moving averages, volume, RSI, stochastic oscillators, Bollinger bands, Fibonacci retracements, and support/resistance to identify trends and assess momentum. These indicators offer insights into market behavior, aiding swing traders in making well-timed buy or sell decisions. Overall, these tools help navigate market fluctuations and strategically execute trades.
Also, To know the Top Bank Nifty Options Strategies, Click Here
Disclaimer: The information provided in this Blog is for educational purposes only and should not be construed as financial advice. Trading in the stock market involves a significant level of risk and can result in both profits and losses. Spider Software & Team does not guarantee any specific outcome or profit from the use of the information provided in this Blog. It is the sole responsibility of the viewer to evaluate their own financial situation and to make their own decisions regarding any investments or trading strategies based on their individual financial goals, risk tolerance, and investment objectives. Spider Software & Team shall not be liable for any loss or damage, including without limitation any indirect, special, incidental or consequential loss or damage, arising from or in connection with the use of this blog or any information contained herein. ![]()


