
Elliott Wave Theory is a way of understanding how stock prices move in the market.
What is Elliot Wave
Elliott Wave Theory is a way of understanding how stock prices move in the market. It was developed by Ralph Nelson Elliott, who noticed that stock prices follow repetitive patterns that look like waves. Just like waves in the ocean, these patterns repeat over & over again.
By studying these wave patterns, investors can try to predict where stock prices might go in the future. It helps them understand the trends and changes in the market. By recognizing the waves, investors can gain insight into the behaviour of other investors and make better decisions about buying or selling stocks.
However, it’s important to note that predicting stock prices is not always easy or guaranteed. Elliott Wave Theory is just one tool among many that investors use to analyse the market.
How does Elliot Wave work?
The Elliott wave theory is a type of technical analysis that aids traders in understanding the cycles of the financial markets.
The way people think and behave in groups affects how the stock market moves, according to the Elliott Wave Theory. The theory suggests that the market goes through cycles of optimism (bullish) and pessimism (bearish), and these cycles shape the patterns we see in stock prices.
Unlike other patterns, Elliott Wave analysis is not a step-by-step guide to follow. It’s more like a tool that helps us understand how trends develop and why prices move the way they do. By studying these patterns, we can gain a better understanding of how the market works and make more informed decisions about buying or selling stocks.
Impulsive Wave Pattern
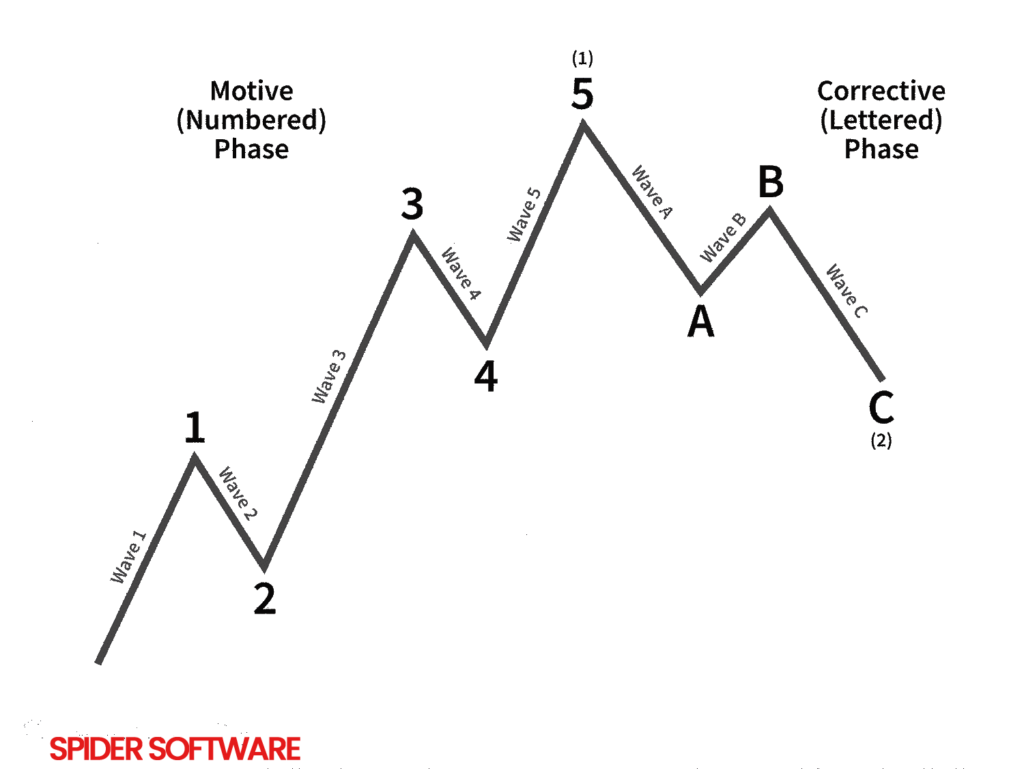
Impulse waves consist of five sub-waves that make net movement in the same direction as the trend of the next-largest degree. This pattern is the most common motive wave and the easiest to spot in a market. It consists of five sub-waves, three of which are motive waves. Two are corrective waves. This is classified as a 5-3-5-3-5 structure, as was previously illustrated.
Its creation is governed by three unbreakable rules:
- Wave two cannot retrace the preceding wave more than 100%.
- Of waves one, three, and five, the third wave can never be the shortest.
- Wave four cannot ever advance past the third wave. The structure is not an acceptable if one of these rules is broken.

Issuance of TDS Certificates to the Payee. (Form 16, Form 16A, Form 16 B and Form 16 C- depending on the transaction)
Remember to complete specific tasks related to tax payment within a designated timeframe. If you don’t follow these rules, you may have to pay extra money as interest or penalties.
The denial of expenses or the possibility of legal action under Section 276B.
Corrective Wave Pattern
Corrective waves, which are also referred to as diagonal waves, consist of either three sub-waves or a combination of three sub-waves. These sub-waves collectively lead to a net movement that is perpendicular to the prevailing trend of the larger degree.
Their purpose, like all motive waves, is to contribute to the movement of the market in the direction of the trend. A corrective wave consists of five sub-waves, but unlike other waves, it may appear like a wedge that is either expanding or contracting.
Depending on the type of diagonal observed, the sub-waves within it may not always be five in number. Each sub-wave of the diagonal, similar to motive waves, is never an exact repetition of the previous sub-wave, and the third wave of the diagonal may not be the shortest wave.

Bottomline
A structure for understanding markets is provided by Elliott Wave theory, but it can be challenging to use as a trading tool due to the allowance of adjustments when rules are broken.
However, it greatly improves the ability to recognize trends clearly. Traders have the flexibility to make Elliott’s principles as complex as they prefer, but many traders prioritize this approach in their market strategies.
Click here to check out our New Blog on Options Trading a must-known skill for earning
Disclaimer: The information provided in this Blog is for educational purposes only and should not be construed as financial advice. Trading in the stock market involves a significant level of risk and can result in both profits and losses. Spider Software & Team does not guarantee any specific outcome or profit from the use of the information provided in this Blog. It is the sole responsibility of the viewer to evaluate their own financial situation and to make their own decisions regarding any investments or trading strategies based on their individual financial goals, risk tolerance, and investment objectives. Spider Software & Team shall not be liable for any loss or damage, including without limitation any indirect, special, incidental or consequential loss or damage, arising from or in connection with the use of this blog or any information contained herein.