
In the stock market today, Nifty slides below 21,600, as Sensex witnesses a sharp decline of 1,628 points; Nifty Bank registers a 4% decrease.
Stock Market Nifty Chart Prediction.
The market experienced its most significant single-day drop in the past 1.5 years as Nifty slipped below 21,600. At the close, Sensex declined by 1,628.01 points (2.23%) to 71,500.76, and Nifty was down by 460.30 points (2.09%) at 21,572. Among the Nifty losers were HDFC Bank, Tata Steel, Kotak Mahindra Bank, Axis Bank, and Hindalco Industries, while gainers included HCL Technologies, SBI Life Insurance, Infosys, LTIMindtree, and TCS. Except for IT, all other sectors closed in the red, with the bank index witnessing a 4% drop, and auto, metal, oil & gas, and realty down 1-2%. The BSE Midcap and Smallcap indices each recorded a 1% decline.
Stock Prediction for 18th Jan 2024
| STOCK | Good Above | Weak Below |
| CUMMINSIND | 2020 | 2000 |
| LT | 3600 | 3570 |
| INFY | 1640 | 1620 |
| MFSL | 938 | 925 |
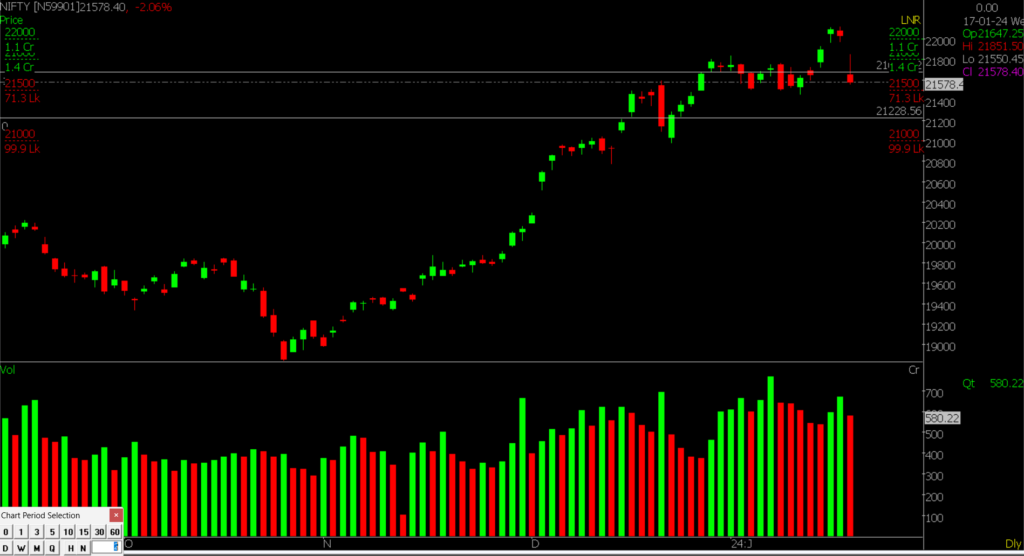
Prediction For Thursday NIFTY can go up if it goes above 21800 or down after the level of 21500 but all depends upon the Global cues.

Nifty saw a notable drop due to profit-taking after reaching a record high of 22,124 in the last trading session. This led the index to the 21-day Exponential Moving Average (21EMA), an important short-term indicator. If Nifty falls below 21,500, where the 21EMA is located, sentiment may worsen. A breach of 21,500 could push the index towards 21,230. Conversely, resistance is at 21,680, and breaking that level could lead to further gains, possibly up to 21,800.
| Highest Call Writing at | 21800 (1.4 Crores) |
| Highest Put Writing at | 21500 (71.3 Lakhs) |
Nifty Support and Resistance
| Support | 21,500, 21230 |
| Resistance | 21,680, 21,800 |
Bank Nifty Daily Chart Prediction.
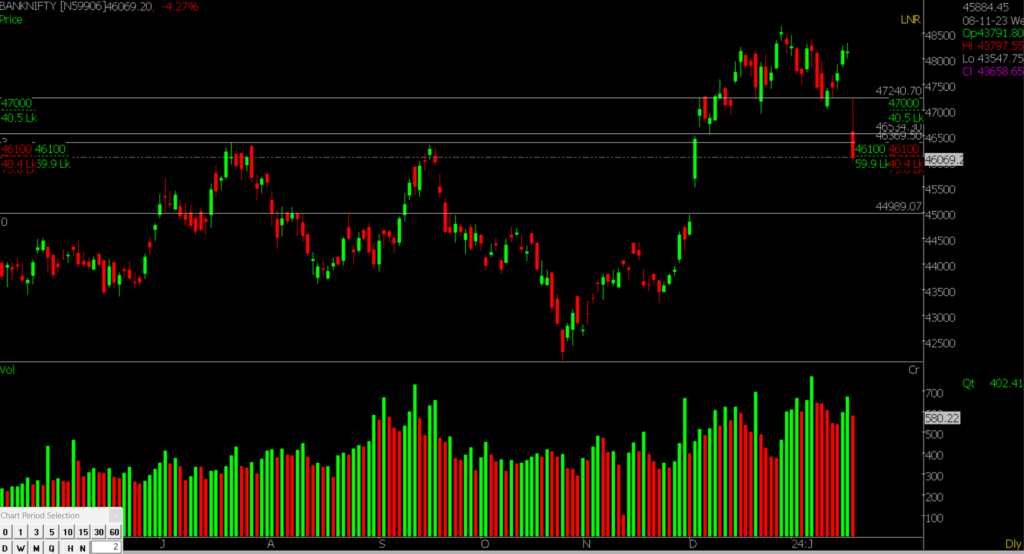
Prediction For Thursday Bank NIFTY can go up if it goes above 46500 or down after the level of 46000 but it all depends upon the Global cues.
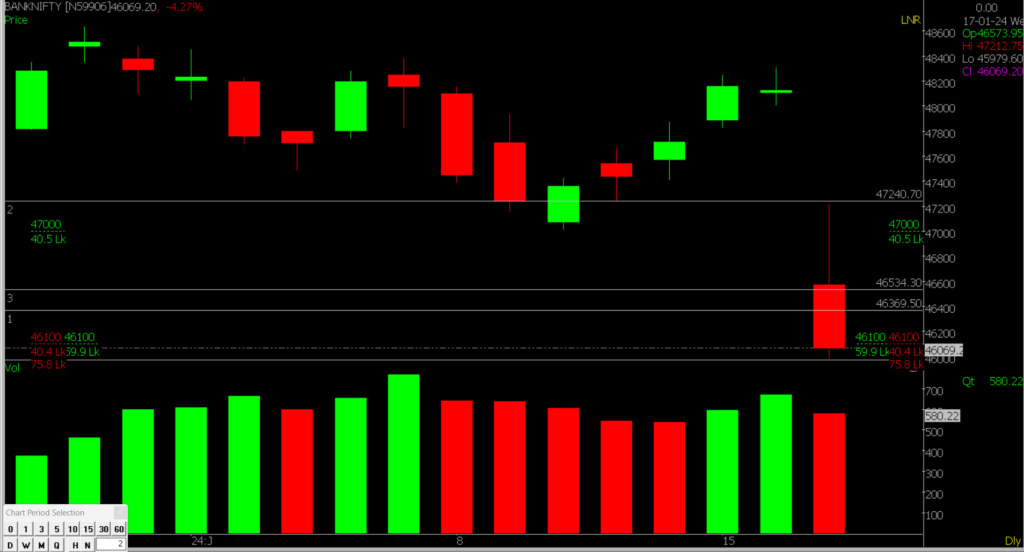
Bank Nifty faced a steep decline driven by a sell-off in HDFC Bank, causing the index to sharply drop below the 38.20% Fibonacci Retracement level from the recent rally. Furthermore, the index retreated within the range of the previous high after a breakdown in consolidation on the daily chart. The sentiment is expected to stay weak, with immediate support around 46,000-45,900. If it goes below 45,900, there could be a further correction towards 45,500. On the upside, resistance is noted at 46,500.
| Highest Call Writing at | 46500 (40.5 Lakhs) |
| Highest Put Writing at | 46000 (40.4 Lakhs) |
Bank Nifty Support and Resistance
| Support | 46,000, 45,900 |
| Resistance | 46,500, 46,900 |
Also, check our Article on uses of Greek Analysis in Options Trading
If you’d like to know how we analyze the market and provide accurate levels every day. then click on the Free Demo button below and change your trading life for good. 5X returns are possible in options trading If you have Spider Software in your trading system.
Disclaimer: The information provided in this Blog is for educational purposes only and should not be construed as financial advice. Trading in the stock market involves a significant level of risk and can result in both profits and losses. Spider Software & Team does not guarantee any specific outcome or profit from the use of the information provided in this Blog. It is the sole responsibility of the viewer to evaluate their own financial situation and to make their own decisions regarding any investments or trading strategies based on their individual financial goals, risk tolerance, and investment objectives. Spider Software & Team shall not be liable for any loss or damage, including without limitation any indirect, special, incidental or consequential loss or damage, arising from or in connection with the use of this blog or any information contained herein. ![]()