The risk/reward ratio helps traders assess if a trade is worth it by comparing potential gains to the risk involved. Lower ratios mean less risk for similar rewards.
Explaining Risk Reward Ratio.
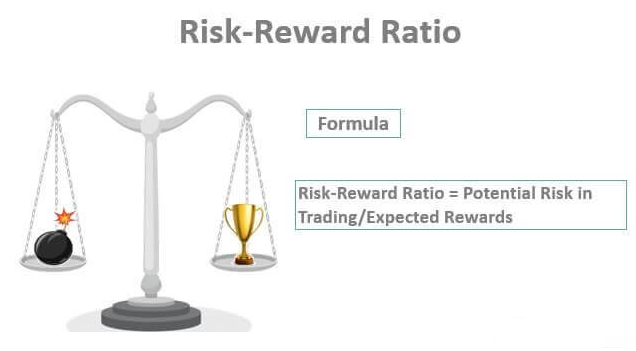
The risk/reward ratio gauges potential gains versus potential losses in Intra-day trading. People use it to figure out if that particular trade is worth it. If the ratio is lower, it means you’re taking less risk to make a similar profit, which is usually better.
For instance, a 1:5 risk-reward ratio in Intraday trading means risking Rs 1 to earn Rs 5. In options trading, 1:3 indicates investing Rs 1 to potentially gain Rs 3. Traders use it to choose trades. You calculate it by dividing the potential loss (risk) by the expected profit (reward) when closing the position.
How to use the Risk Reward Ratio?
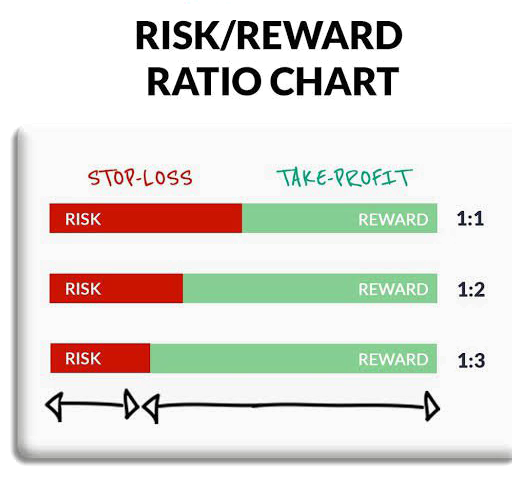
Market strategists often look for a risk/reward ratio of around 1:3, meaning they aim for three units of expected return for every one unit of extra risk. Traders can use tools like stop-loss orders and put options to manage risk.
This ratio is commonly used when trading stocks, but the ideal ratio varies depending on the trading strategy. It usually takes trial and error to find the right ratio for a strategy, and many traders have a predetermined ratio. The risk/return ratio can be calculated based on personal risk tolerance or by objectively assessing a trade/investment risk and return. To estimate potential losses, traders use various methods, including technical analysis, historical price volatility, fundamental analysis, and models like value-at-risk (VaR). These methods help identify factors that might affect a trade/investment’s value and predict potential downsides.
The Benefit:
The risk/reward ratio is vital for traders, it helps to control their losses and ensure profitability. It calculates the difference between the trade entry point and stop-loss, comparing potential profit to potential loss.
To manage risk, traders use stop-loss orders when trading individual stocks. These orders automatically sell a stock if it hits a predetermined low, helping minimize losses. Setting stop-loss orders is convenient and doesn’t involve high trading costs.
Example: Let’s consider this example: A trader buys 100 shares of ABC Company at Rs 20 and sets a stop-loss order at Rs 15 to limit potential losses to Rs 500. The trader believes ABC’s price will reach Rs 30 in a few months. Here, the trader is willing to risk Rs 5 per share to gain Rs 10 per share upon selling. This results in a 1:2 risk/reward ratio for this trade. Traders can use derivatives like put contracts for a similar purpose.
Certainly, if an investor wants a 1:5 risk/reward ratio, meaning they aim to gain five units of return for every one unit of risk, they can adjust their stop-loss order accordingly. However, it’s crucial to realize that by making this adjustment, the investor is altering the likelihood of their trade being successful.
In the previous trading example, mentioned above, let’s say the investor set a stop-loss order at Rs 18 instead of Rs 15, while still aiming for a Rs 30 profit target. This would indeed reduce the potential loss (assuming they keep the same number of shares), but it increases the chances of the stop-loss being triggered. This is because the stop order is much closer to the entry price than the profit target. So, while the potential gain is larger compared to the potential loss, the likelihood of achieving that gain is lower.
How to Calculate Risk Reward Ratio?
It’s all about comparing the potential profit with the potential loss in a trade. Here’s how you do it:
Identify Your Entry and Exit Points: First, you need to know where you’re entering a trade and where you plan to exit. Let’s say you buy a stock at Rs 100 (entry) and set a target to sell it at Rs 120 (exit).
Determine Your Risk: Next, you figure out your risk, which is usually based on how much you’re willing to lose. For example, you might set a stop-loss order at Rs 95, meaning you’re willing to risk Rs 5 per share.
Calculate the Potential Reward: Now, calculate your potential reward, which is the difference between your exit point (Rs 120) and your entry point (Rs 100). In this case, it’s Rs 20 per share.
Find the Ratio: Simply divide your potential reward by your risk. In this example, it’s Rs 20 (reward) divided by Rs 5 (risk), which equals a 1:4 risk/reward ratio.
So, in this trade, you’re risking Rs 5 to potentially gain Rs 20, which gives you a risk/reward ratio of 1:4. This ratio helps you assess if the trade is worth taking, as a higher ratio typically indicates a more favorable opportunity.
Summary.
To sum up, The risk-reward ratio measures the potential profit against the potential loss in an investment or project. A higher ratio is better as it promises more returns with less risk. But a ratio that’s too high might be too risky, and one that’s too low could be suspicious. It’s essential to consider your risk tolerance and investment goals to find the right ratio for your portfolio. Strategies like diversification, protective put options, and stop-loss orders can help fine-tune your risk-return balance.
Also, Check out our article on Top of Cryptocurrencies to look for in 2023.
Disclaimer: The information provided in this Blog is for educational purposes only and should not be construed as financial advice. Trading in the stock market involves a significant level of risk and can result in both profits and losses. Spider Software & Team does not guarantee any specific outcome or profit from the use of the information provided in this Blog. It is the sole responsibility of the viewer to evaluate their own financial situation and to make their own decisions regarding any investments or trading strategies based on their individual financial goals, risk tolerance, and investment objectives. Spider Software & Team shall not be liable for any loss or damage, including without limitation any indirect, special, incidental or consequential loss or damage, arising from or in connection with the use of this blog or any information contained herein. ![]()