A flag pattern is a chart pattern used in technical analysis to identify potential price continuation. It consists of a strong price move, known as the flagpole, followed by a period of consolidation forming a flag shape.
What Is Flag Pattern
The flag is characterized by smaller price swings contained within parallel trendlines. A bullish flag pattern indicates the likely continuation of an uptrend, while a bearish flag pattern suggests a continuation of a downtrend. Traders often wait for breakouts above the upper trendline in bullish flags or below the lower trendline in bearish flags before entering trades. However, it’s important to use the pattern in conjunction with other analysis tools for confirmation. By considering additional factors and indicators, traders can make more informed trading decisions.
How to use flag Pattern
To effectively use the flag pattern in trading, follow these steps:
- Identify the Flag Pattern: Look for a strong price move followed by a consolidation period forming a flag shape. The flag should have smaller price swings within parallel trendlines.
- Determine the Trend: Identify the prevailing trend in the market. A bullish flag occurs in an uptrend, while a bearish flag forms in a downtrend. Confirm the trend using other indicators or analysis tools.
- Wait for Breakout: Monitor the price action within the flag pattern and wait for a breakout. In a bullish flag, look for a breakout above the upper trendline, and in a bearish flag, wait for a breakout below the lower trendline.
- Confirm with Volume and Indicators: Analyze volume during the breakout. Ideally, a breakout should be accompanied by increased volume, confirming the strength of the move. Use additional indicators or oscillators for further confirmation.
- Set Entry and Exit Points: Once the breakout is confirmed, determine entry and exit points. For a bullish flag, consider entering above the upper trendline and placing a stop-loss below the lower trendline. For a bearish flag, enter below the lower trendline and set a stop-loss above the upper trendline. Set profit targets based on the length of the flagpole or other technical factors.
- Monitor and Manage the Trade: Keep a close watch on price movements after entering the trade. Adjust stop-loss orders if necessary and consider taking partial profits as the trade progresses. Be aware of potential reversals or invalidations of the pattern.
Remember, using the flag pattern alone may not guarantee success. Combine it with other technical analysis tools, such as trendlines, support and resistance levels, and indicators, to enhance the effectiveness of your trading decisions.
Flag pattern on LAL_T in Daily charts
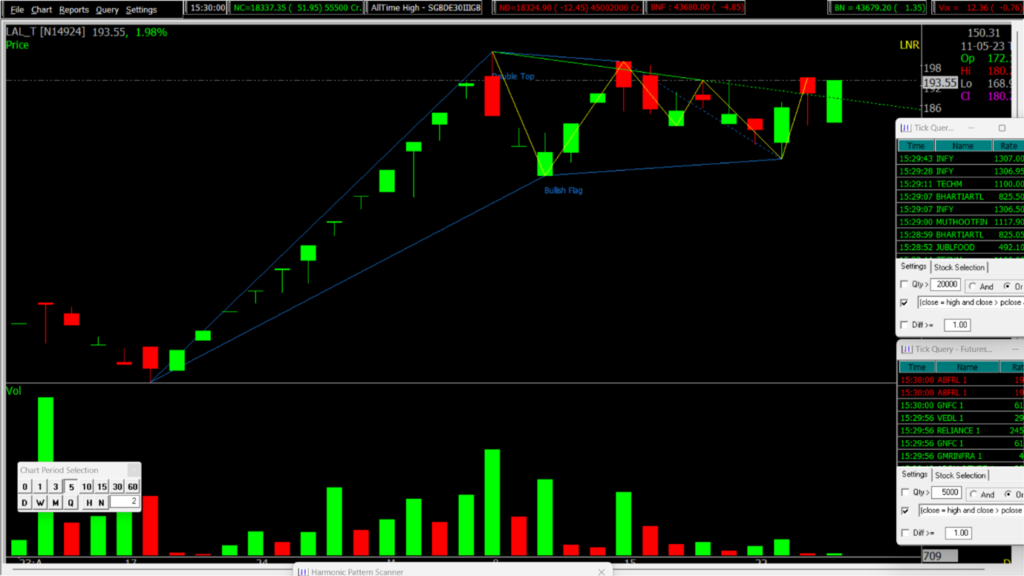
LAL_T is exhibiting a potential Flag pattern chart pattern in its daily chart. Three Top have formed at a similar level, with a consolidation period in between. These top have created a strong Resistance level that has held up against three tests by the price. The pattern suggests that buying pressure may have been exhausted and sellers may be stepping in to resist the price.. However, traders should always confirm the pattern before entering a trade and implement proper risk management measures to mitigate potential losses.
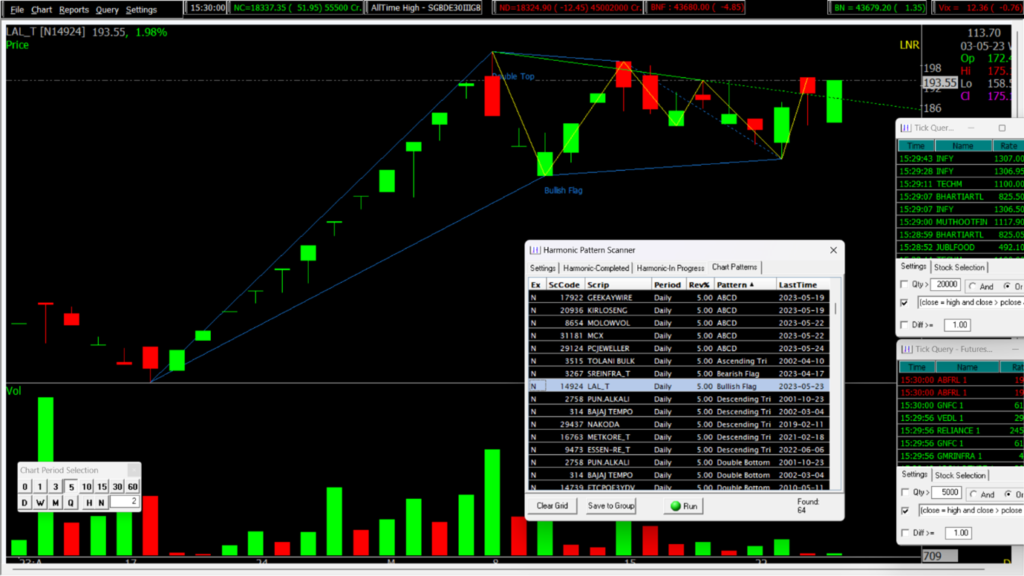
How to find the Stocks with Flag pattern pattern Formation?
It is super easy to find any chart pattern using Spider Software Flag pattern can be found using the Chart Pattern Scanner of Spider, in just a couple of clicks.
Also, Check our Blog on The Most Common Momentum Indicators in the Stock Market.
Disclaimer: The information provided in this Blog is for educational purposes only and should not be construed as financial advice. Trading in the stock market involves a significant level of risk and can result in both profits and losses. Spider Software & Team does not guarantee any specific outcome or profit from the use of the information provided in this Blog. It is the sole responsibility of the viewer to evaluate their own financial situation and to make their own decisions regarding any investments or trading strategies based on their individual financial goals, risk tolerance, and investment objectives. Spider Software & Team shall not be liable for any loss or damage, including without limitation any indirect, special, incidental or consequential loss or damage, arising from or in connection with the use of this blog or any information contained herein. ![]()


