Traders use this wedge pattern to identify potential trend reversals in the stock market, with two types of wedge patterns, rising and falling, providing different signals depending on the breakout direction.
What is Wedge Pattern?
A wedge pattern forms at the top or bottom of a trend as the trading activities confine within converging straight lines.
It takes 3 to 4 weeks to complete a wedge pattern and has a rising or falling slant pointing in the same direction.
This pattern differs from a triangle as both the boundary lines slope up or down.
Falling and rising wedges are minor trends and not major patterns.
Once the primary trend resume, the wedge pattern becomes ineffective as a technical indicator.
Formation Of Wedge Pattern.
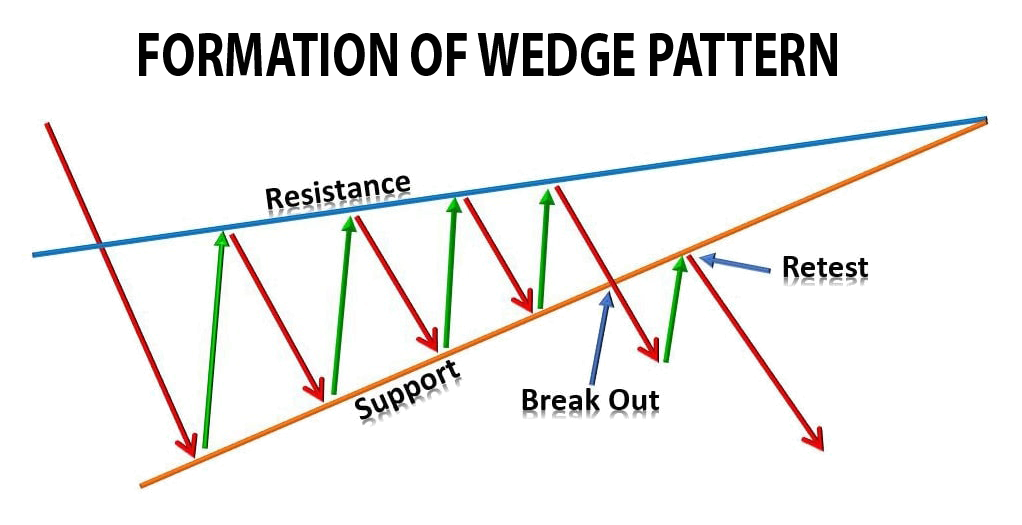
Stock price movements or security on a chart help to form a Wedge Pattern.
Drawing two converging trend lines forms a triangle-like shape that creates a wedge pattern. The formation of the pattern is based on any time frame, for daily, weekly, or monthly price movements.
The two types of Wedge Patterns – rising wedge and falling wedge.
Traders and analysts use the Wedge Pattern to identify potential trend reversals and to make trading decisions based on the pattern’s breakout direction.
Types of Wedge Patterns
There are Two Types of Wedge Patterns to trade in the stock market:
1. Rising Wedge Pattern
2. Falling Wedge Pattern
What is a Rising Wedge Pattern?
A rising wedge pattern is a chart pattern indicating a bearish trend. It suggests an upcoming breakdown in the stock price. This pattern is the opposite of the bullish falling wedge pattern and both together form a popular wedge pattern. The rising wedge can indicate both continuation and reversal patterns, but continuation patterns are more common and effective as they follow the overall trend direction.
Traders and analysts use the rising wedge pattern to identify potential trend reversals and to make trading decisions based on the pattern’s breakout direction.
A downward breakout from the pattern can signal a potential drop in the stock price.
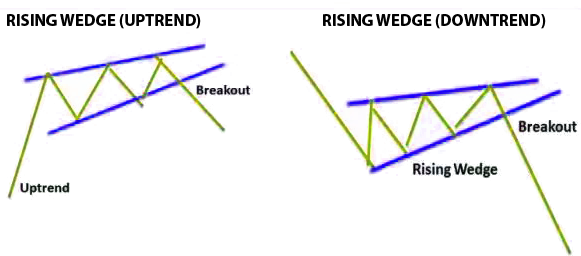
Rising Wedge Pattern (Uptrend)
When prices make higher highs and higher lows than the previous price movements, they form a rising wedge pattern that reverses an uptrend.
Traders and analysts use the rising wedge pattern in an uptrend to identify potential trend reversals and to make trading decisions based on the pattern’s breakout direction.
A downward breakout from the pattern can signal a potential reversal of the uptrend and a potential decline in the stock price.
Rising Wedge Pattern (Downtrend)
When prices make higher highs and higher lows compared to the previous price movements, they form a rising wedge pattern in the downtrend, indicating a continuation of the previous trend.
Traders and analysts use the rising wedge pattern in a downtrend to identify potential trend reversals and to make trading decisions based on the pattern’s breakout direction.
A downward breakout from the pattern can signal a potential continuation of the downtrend and a potential further decline in the stock price.
Below given is an example of how to analyze a Rising Wedge Pattern in different trends.
What is a Falling Wedge Pattern?
A falling wedge pattern is a chart pattern indicating a bullish trend. Two converging trend lines form a falling wedge pattern and the stock prices have fallen for a certain period.
Traders and analysts use the falling wedge pattern to identify potential trend reversals and to make trading decisions based on the pattern’s breakout direction.
An upward breakout from the wedge pattern can signal a potential rise in the stock price, making it an important tool for traders to make informed decisions and maximize profits in the stock market.
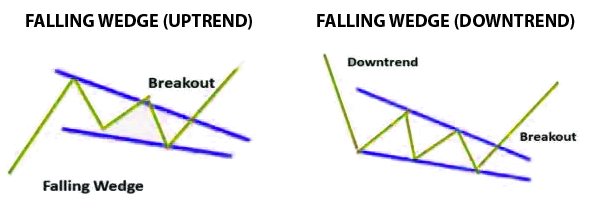
Falling Wedge Pattern (Uptrend)
Lower highs and lower lows in the price movements compared to the previous price movements form a falling wedge pattern in the uptrend, indicating the continuation of the uptrend.
Traders and analysts use the falling wedge pattern in an uptrend to identify potential trend reversals and to make trading decisions based on the pattern’s breakout direction.
An upward breakout from the pattern can signal a potential rise in the stock price.
Falling Wedge Pattern (Downtrend)
When the price movements of a stock or security create lower highs and lower lows within a triangle-like shape on a chart, they form a falling wedge pattern in a downtrend.
The two converging trend lines slope downwards, creating this pattern.
Traders and analysts use the falling wedge pattern in a downtrend to identify potential trend reversals and to make trading decisions based on the pattern’s breakout direction.
An upward breakout from the pattern can signal a potential reversal of the downtrend and a potential rise in the stock price.
Below given is an example of how to analyze a Falling Wedge Pattern in different trends.
Steps On How To Create A Wedge Pattern
- Start with a chart that shows the price movements of a stock or security over time. This chart can be based on any time frame, such as daily, weekly, or monthly price movements.
- Identify two significant trend lines that are sloping in the same direction. To draw the trend lines, one should connect the highs or lows of the price movements.
- Draw these trend lines so that they converge towards each other, forming a triangle-like shape to create a wedge pattern.
- Determine whether the Wedge Pattern is a rising wedge or a falling wedge. Higher highs and higher lows in the price movements within the pattern form a rising wedge, while a Lower highs and lower lows in the price movements within the pattern form a falling wedge.
- Evaluate the pattern’s breakout direction. Traders and analysts use the Wedge Pattern to identify potential trend reversals and to make trading decisions based on the pattern’s breakout direction. A breakout occurs when the price movements break through one of the trend lines, indicating a potential shift in the direction of the trend.
- Evaluate the pattern’s breakout direction. Traders and analysts use the Wedge Pattern to identify potential trend reversals and to make trading decisions based on the pattern’s breakout direction. A breakout occurs when the price movements break through one of the trend lines, indicating a potential shift in the direction of the trend.
By following these steps, one can identify all the aspects of the market, its trends even if it’s reversal and can make trading systematic.
Key Takeaways For Wedge Pattern
- Traders and analyst use wedge patterns mainly to identify potential trend reversals and make trading decisions in the stock market.
- There are two types of wedge patterns- Rising Wedge and Falling Wedge, each providing a different signal depending on the breakout direction.
- Traders use various technical indicators like moving averages, RSI, and price breakouts to identify potential entry and exit points.
- Successful implementation of this strategy requires discipline, risk management, and a solid understanding of market dynamics and technical analysis principles.
Disclaimer: The information provided in this Blog is for educational purposes only and should not be construed as financial advice. Trading in the stock market involves a significant level of risk and can result in both profits and losses. Spider Software & Team does not guarantee any specific outcome or profit from the use of the information provided in this Blog. It is the sole responsibility of the viewer to evaluate their own financial situation and to make their own decisions regarding any investments or trading strategies based on their individual financial goals, risk tolerance, and investment objectives. Spider Software & Team shall not be liable for any loss or damage, including without limitation any indirect, special, incidental or consequential loss or damage, arising from or in connection with the use of this blog or any information contained herein. ![]()