What is a Double Bottom Candlestick Pattern?
The double bottom pattern is a chart pattern that shows a major shift in the market trend from falling to rising.
![]()

The double bottom pattern is a chart pattern that shows a major shift in the market trend from falling to rising.
![]()

In Technical Analysis, the most crucial tool to start Options, we need to know different Candlestick Patterns. Different Candlesticks Patterns help traders to understand the overall stock market strategy.
![]()

A shooting star candlestick signals potential reversal at uptrend peak, with small body and long upper shadow, implying bearish sentiment.
![]()

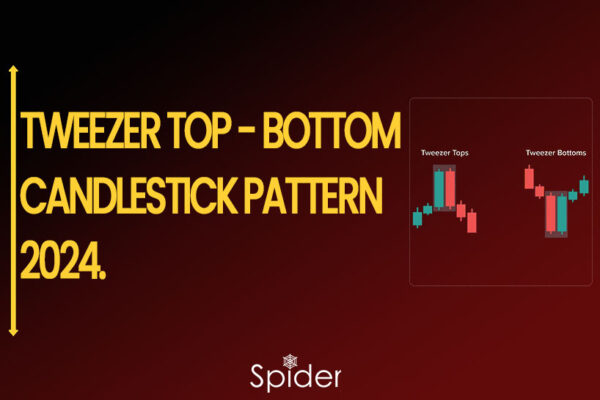
Tweezer candlestick patterns signal trend changes. Tweezer Top indicates a potential shift to bearish, while Tweezer Bottom suggests a shift to bullish.
![]()

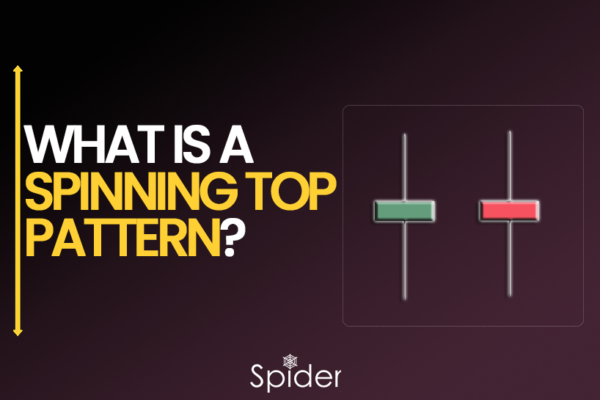
The Spinning Top Candlestick signifies market indecision with a brief central body flanked by long upper and lower shadows, suggesting potential price reversals.
![]()

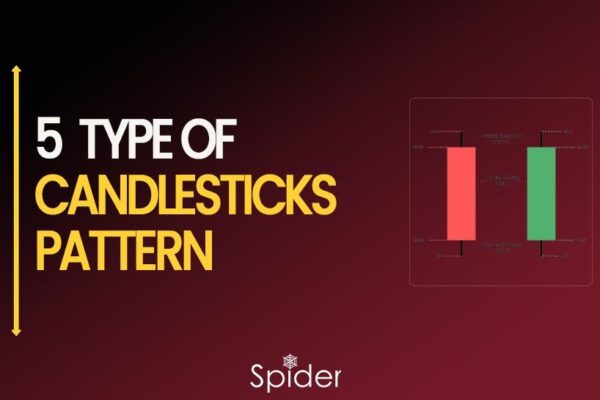
we will see 5 major types of Candlestick Patterns like hanging man, Evening Star, Hammer, Morning Star , Shooting Star. Candlestick Patterns
![]()