In Technical Analysis, the most crucial tool to start Options, we need to know different Candlestick Patterns. Different Candlesticks Patterns help traders to understand the overall stock market strategy.
What is Candlestick?
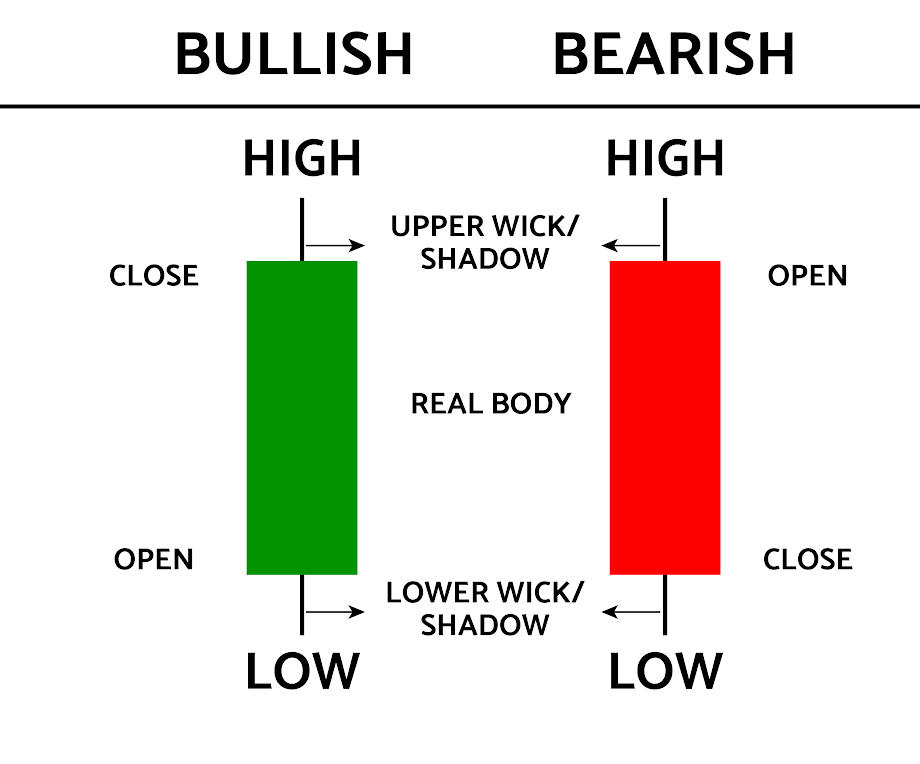
Candlestick helps to know best possible price based on past patterns. Candlesticks helps to know four possible things i.e. (high, low, open, close) throughout the market which helps trader to get knowledge about market easily.
The candlestick can either be green or red. Green candlestick refers that the closing price is more than opening price which indicates good sign whereas Red candlestick refers that opening price was more than closing price which indicates bad sign.
Types of 5 most powerful candles:
1. Hammer:
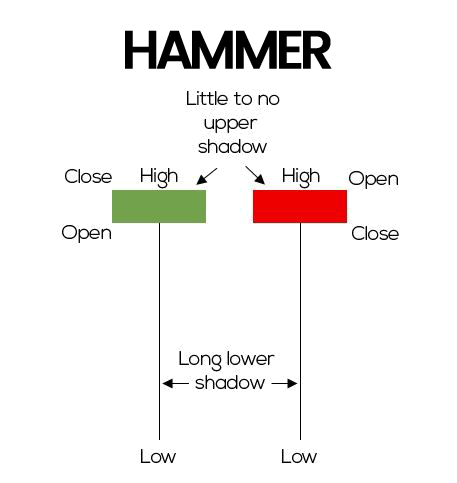
The Hammer candlestick is shaped as short body and long lower wick, typically like hammer. It generally occurs after declining of price. It is found at downward trend. The hammer candlestick occurs when sellers enter into the market, when market is declining.
Hammer candlestick helps to know that stock has touched it’s bottom period and is now to take reversal position. It is formed when closing price and high is same and is considered stronger formation. It indicates that stock should reverse trends and start rising.
2. Doji :
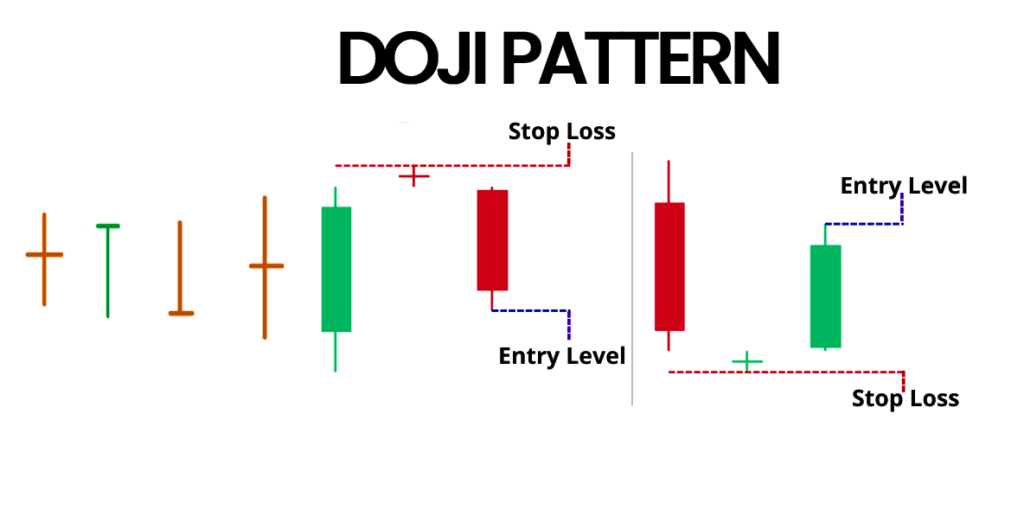
The pattern of Doji is like a cross or a star. This candlestick occurs when opening and closing price are same. The word “Doji” itself means same thing.
Although prices may have changed between the open and close of the candle, the fact that the open and close are almost the same indicates that the market has been unable to decide whether to take the pair up or down.
3 Types of Doji:
Standard Doji:
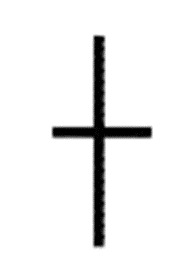
A standard doji is shaped as plus sign. To understand standard doji, traders price action that builds up to the doji.
Long-Legged Doji:

This types of Doji has longer vertical lines above and below of horizontal lines. If Long legged Doji occurs above it seems that trader could change direction.
Dragonfly Doji:

Dragonfly Doji can either occurs upwards or downwards in form of ‘T’ shape which indicates change in direction.
3. Three-white soldiers:
Three-white soldiers pattern occurs during declining period and is observed as reversal indicator. It is formed when price consists of three long body candles that close near their highs with wick or no wicks.
The pattern helps to predict change in the direction. It is very strong signal that occurs during downtrend and shows steady advance of buying pressure.
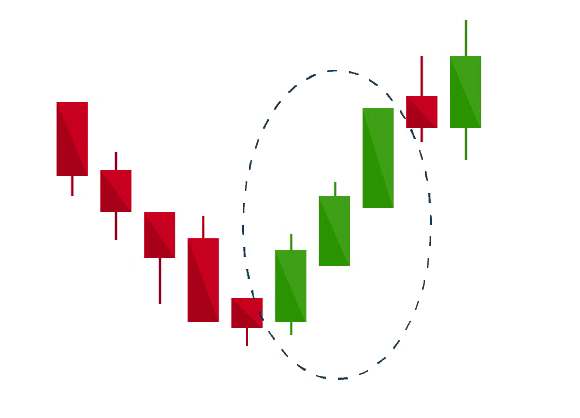
4. Bullish Engulfing:
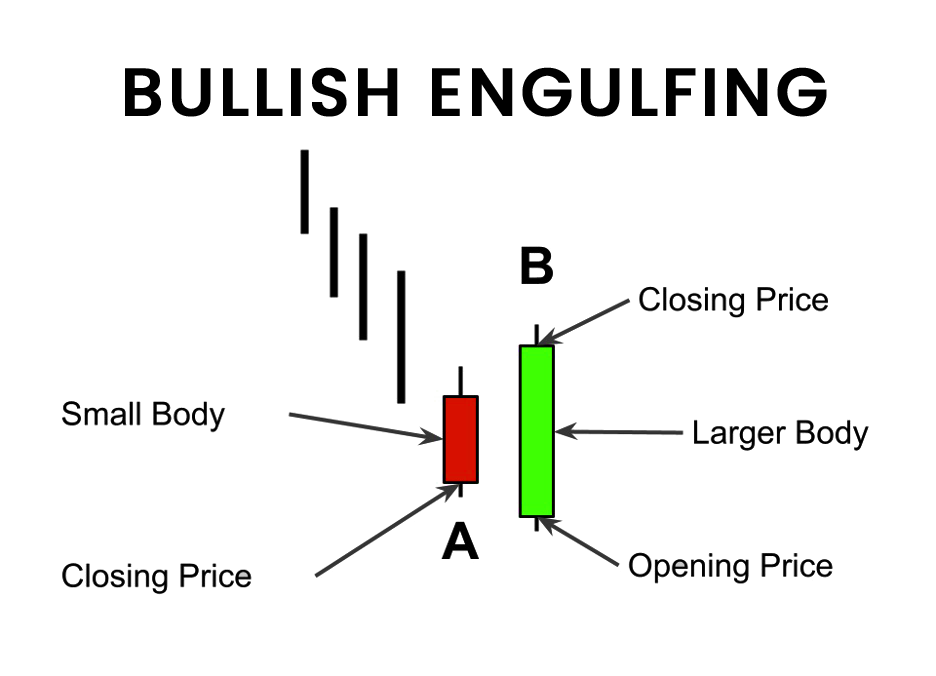
The pattern formed by two candlesticks. This pattern appears in downtrend and it consists of one dark who follows larger hollow candle. One candlestick of green color which is larger body and another is red color which is short and engulfed of green color.
To form a bullish engulfing pattern, the stock must open lower on Day 2 than it closed on Day 1. In bullish engulfing patterns, the upper wick of the white candlestick is usually small. In the case of bullish engulfing patterns, four or more black candlesticks are more likely to signal a reversal.
5. Tweezer Bottom:
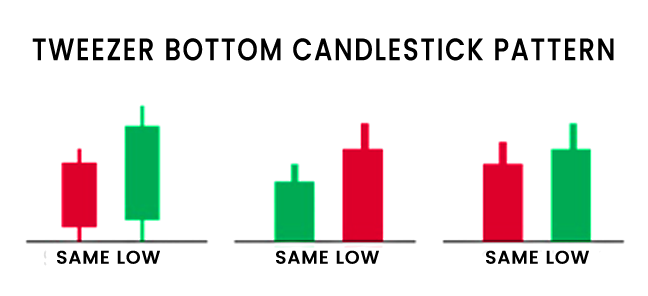
Tweezer Bottom is a reversal pattern which occurs at downstream bottom line. There will be two color candles at same point. Reversals are more reliable when the first candle has a large body and the second has a short body.
Tweezer Bottom shows strong bullish pattern. It helps to know that buyers are entered into market and are buying from same level and sellers are getting weak. You will easily get to know that Tweezer Bottom candlestick appeared on price chart when two or more candles have same lows.
Click here to know the Best PSU Stock to Invest in India – 2024
Join our upcoming FREE WEBINAR on “How to Identify Reversal in Harmonic Pattern”
If you’d like to know how we analyze the market and provide accurate levels every day. then click on the Free Demo button below and change your trading life for good. 5X returns are possible in options trading If you have Spider Software in your trading system.
Disclaimer: The information provided in this Blog is for educational purposes only and should not be construed as financial advice. Trading in the stock market involves a significant level of risk and can result in both profits and losses. Spider Software & Team does not guarantee any specific outcome or profit from the use of the information provided in this Blog. It is the sole responsibility of the viewer to evaluate their own financial situation and to make their own decisions regarding any investments or trading strategies based on their individual financial goals, risk tolerance, and investment objectives. Spider Software & Team shall not be liable for any loss or damage, including without limitation any indirect, special, incidental or consequential loss or damage, arising from or in connection with the use of this blog or any information contained herein. ![]()