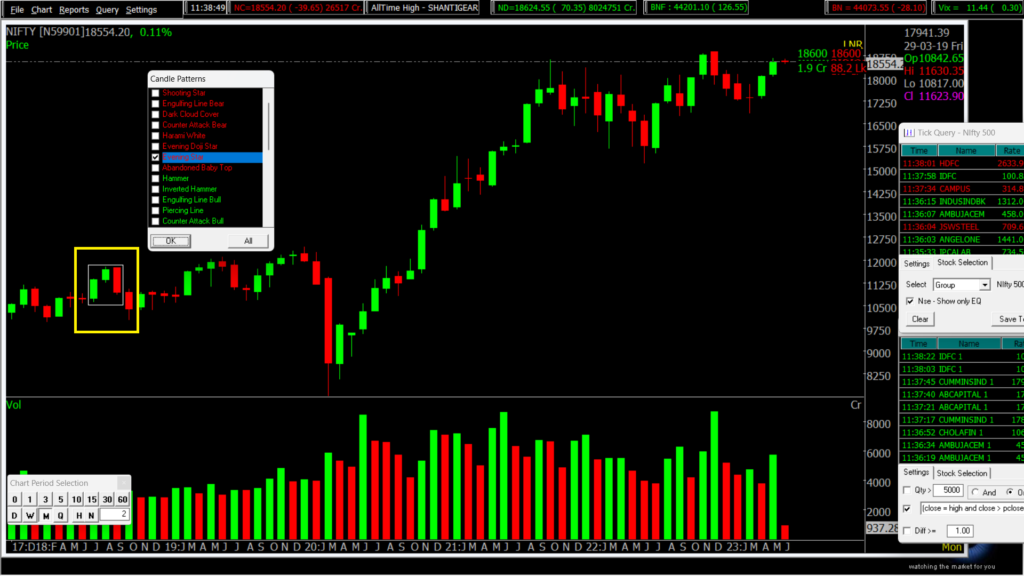
we will see 5 major types of Candlestick Patterns like hanging man, Evening Star, Hammer, Morning Star , Shooting Star. Candlestick Patterns
What is a Candlestick?
A candlestick pattern is indeed a visual representation of price movements in financial trading. Technical analysts widely use a series of candlesticks on a price chart to analyze market trends, forecast future price movements, and make trading decisions.
Candlestick patterns offer valuable insights into the psychology of market participants and can suggest potential reversals, continuations, or indecision in price trends. Each candlestick within a pattern represents a specific time period, such as a day, hour, or minute, depending on the chosen chart timeframe. A candlestick is made up of four main components: the opening price, the closing price, the highest price (referred to as the high), and the lowest price (known as the low). The body of the candlestick is formed by the opening and closing prices, while the high and low prices are indicated by thin lines, often called shadows or wicks
What is Hammer Candlestick Pattern:
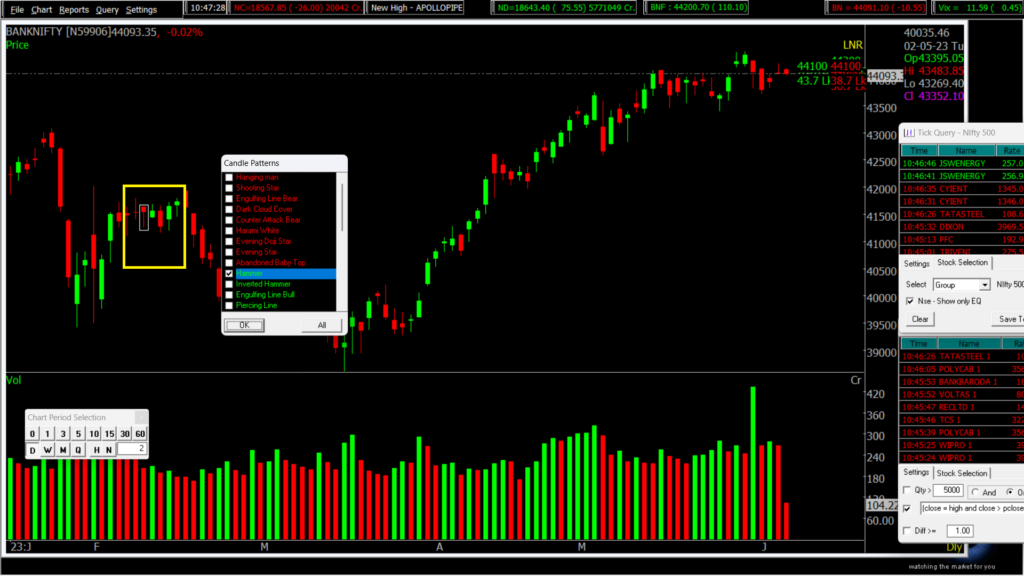
The hammer candlestick pattern actively serves as a technical analysis pattern used for identifying potential bullish reversals in financial markets. Analysts actively describe the hammer candlestick pattern as a bullish reversal pattern that can signal a potential change in trend. Traders can use the hammer candlestick pattern to identify potential buying opportunities, as it suggests that sellers may be losing momentum and buyers are starting to take control
What is Shooting Star Candlestick Pattern?
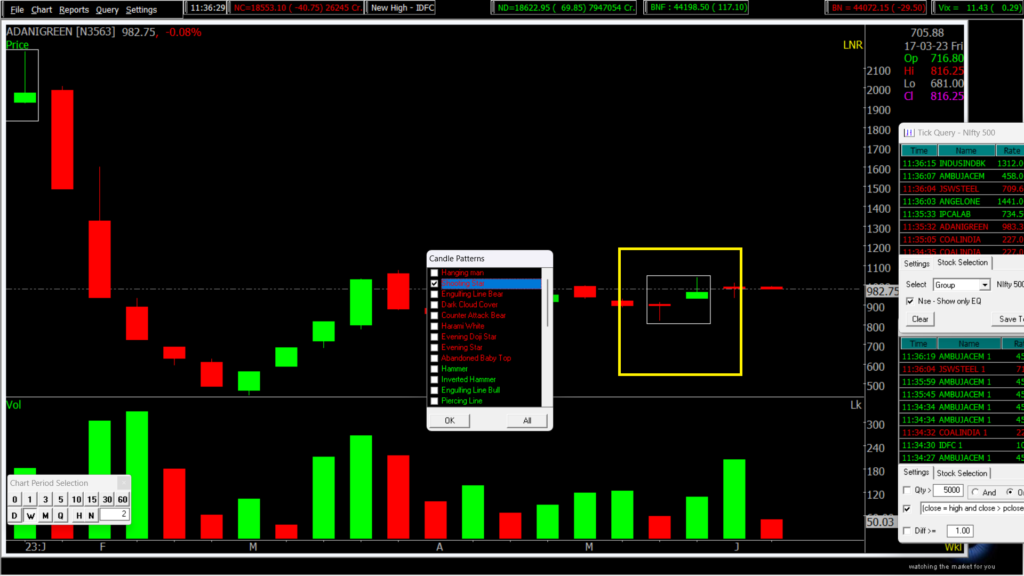
The shooting star pattern typically occurs after an uptrend and is characterized by a small body near the bottom of the candlestick, featuring a long upper shadow or wick that significantly surpasses the body. Technical analysts actively observe this pattern to analyze market trends, forecast future price movements, and make trading decisions. The lower shadow is either absent or very short, giving the pattern its name as it resembles a shooting star.
The shooting star pattern suggests that buyers initially pushed the price higher, but sellers regained control and pushed the price down, resulting in a long upper shadow. The small body near the bottom of the candlestick indicates indecision in the market, with the closing price near the opening price.
What is Morning Star Candlestick Pattern?
The Morning Star candlestick pattern is a bullish reversal pattern that typically occurs at the end of a downtrend. Technical analysts actively monitor the morning star pattern in financial trading as it signifies a potential trend reversal and holds significant importance.
The Morning Star pattern consists of three candlesticks:
- The first candlestick is a large bearish candle that represents the existing downtrend and indicates selling pressure.
- The second candlestick is a smaller-bodied candle, either bullish or bearish, that shows a decrease in selling pressure and an increase in market indecision. It often has long upper and lower wicks, indicating a battle between buyers and sellers.
- The third candlestick is a large bullish candle that closes significantly above the midpoint of the first bearish candle. It confirms the reversal signal and suggests the emergence of buying pressure, potentially starting an upward climb.
What is Evening Star Candlestick Pattern?
Technical analysts actively utilize the evening star pattern in stock-price chart analysis to detect potential trend reversals. Analysts actively consider it a bearish candlestick pattern comprising of three candles: a large white (or green) candlestick, followed by a small-bodied candle, and finally, a red (or black) candle.
Evening star patterns typically occur at the top of an uptrend and suggest that the upward momentum is approaching its end. Traders interpret this pattern as a signal to be cautious and potentially consider selling or taking a bearish position.
Traders actively consider the morning star pattern as a bullish indicator, which serves as the opposite of the evening star pattern. The morning star pattern consists of a large red (or black) candlestick, followed by a small-bodied candle, and then a large white (or green) candlestick.
Although the evening star pattern is not frequently observed, many traders actively regard it as a reliable technical indicator. However, it is important to note that no single indicator or pattern guarantees a specific market outcome. It is always advisable to combine technical analysis with other forms of analysis and risk management techniques when making trading decisions.
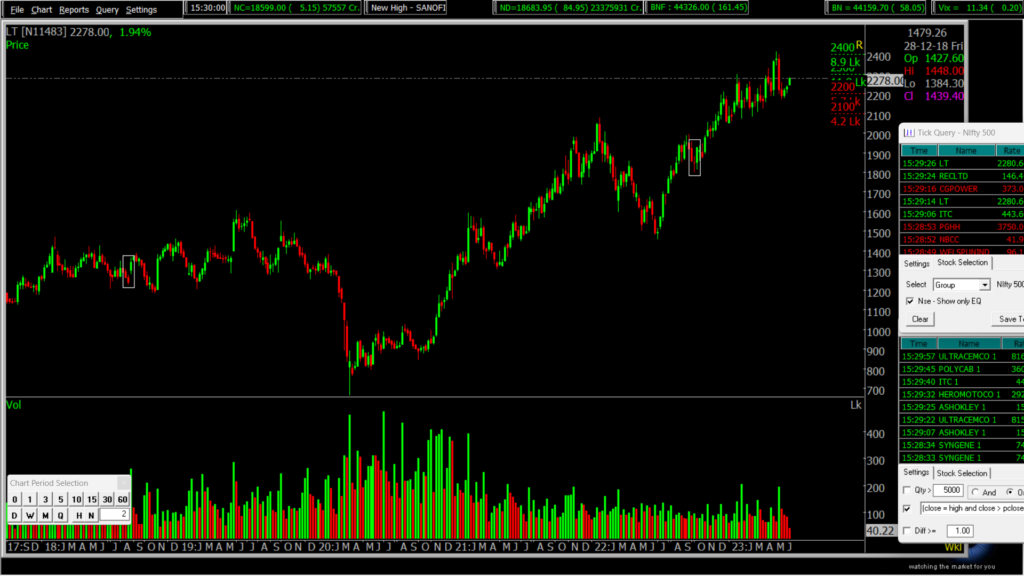
What is a hanging man Pattern?
Analysts name candlestick patterns in a manner that reflects their appearance and characteristics, actively assisting traders in comprehending the nature of the pattern and its location on a chart. The hanging man is indeed a bearish reversal pattern, and its name suggests a sense of foreboding. To construct individual candlesticks, analysts actively employ four data points: the open, close, high, and low prices. These data points provide valuable insights to knowledgeable traders regarding the ongoing battle between bulls and bears, who represent the majority of market participants. Observers can detect candlestick patterns across various time frames, but for the purpose of this discussion, we will concentrate on daily price patterns.
Also, Check our article on TRADING PSYCHOLOGY – The most important aspect of Trading?
Disclaimer: The information provided in this Blog is for educational purposes only and should not be construed as financial advice. Trading in the stock market involves a significant level of risk and can result in both profits and losses. Spider Software & Team does not guarantee any specific outcome or profit from the use of the information provided in this Blog. It is the sole responsibility of the viewer to evaluate their own financial situation and to make their own decisions regarding any investments or trading strategies based on their individual financial goals, risk tolerance, and investment objectives. Spider Software & Team shall not be liable for any loss or damage, including without limitation any indirect, special, incidental or consequential loss or damage, arising from or in connection with the use of this blog or any information contained herein. ![]()


