A shooting star candlestick signals potential reversal at uptrend peak, with small body and long upper shadow, implying bearish sentiment.
What is shooting star?
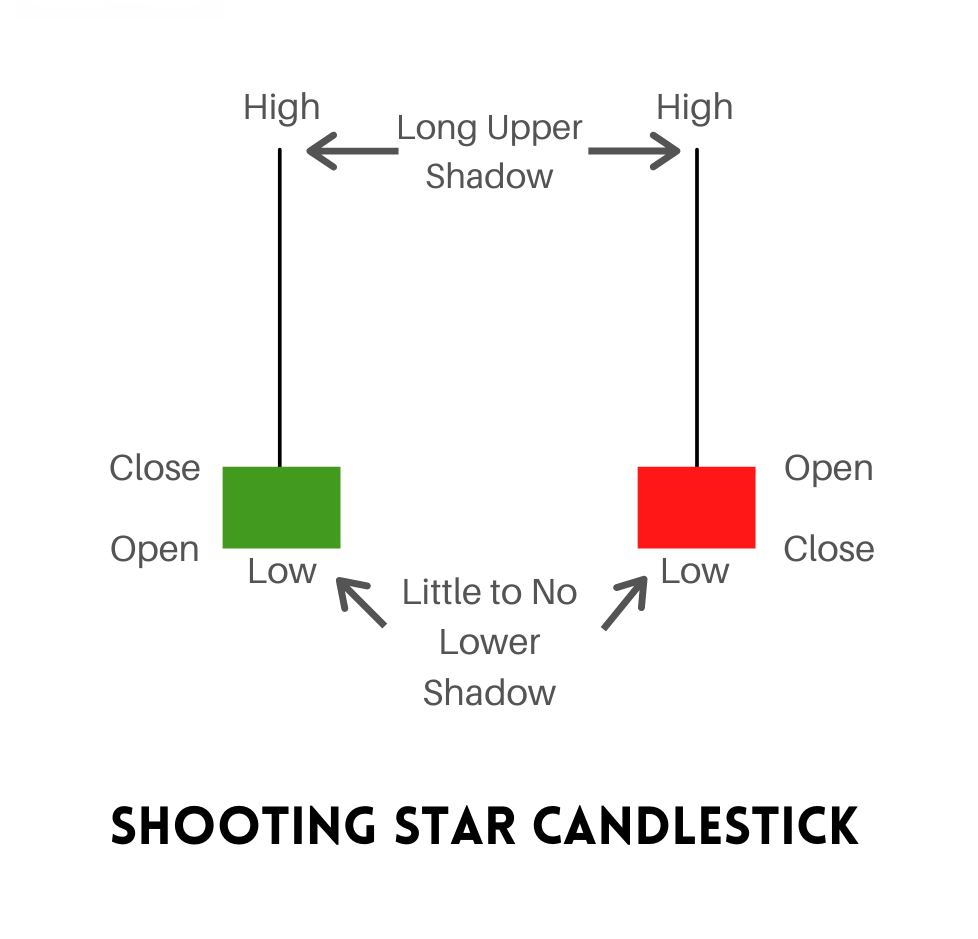
A shooting star candlestick pattern typically appears at the peak of an uptrend. It is a bearish candlestick with a long upper shadow. The shooting star resembles an inverted hammer candlestick, where the wick extends higher instead of lower, while the open, low, and close remain relatively close together.
A candlestick is considered as a shooting star when it emerges amidst a price increase. To qualify, the gap between the day’s highest price and its opening must exceed double the size of the candlestick’s body.
Formation of Shooting Star Candlesticks

What does shooting star tell ?
Shooting stars indicate a potential shift towards a downside movement and are particularly impactful when they follow 2-3 consecutive candles with higher highs. These stars typically open and rise with significant strength during the trading session, reflecting the persistent buying pressure observed in previous sessions.
By the close of the trading session, downward pressure from sellers near the opening indicates a loss of control by buyers, with sellers assuming dominance by day’s end.
The extended upper shadow suggests that buyers are losing strength as the price returns to its opening level. Following the shooting star pattern, the next candle opens lower and continues to decline with high trading volume. This candle confirms a reversal in price direction, signalling a potential further decrease in price.
How to identify the Shooting Star Pattern
- Look for a candlestick with a small body and a long upper shadow.
- The upper shadow should be at least twice the size of the body.
- Typically occurs after an uptrend, signalling a potential reversal.
- Confirmation often comes from the next candle opening lower than the shooting star’s close.
- High trading volume can strengthen the pattern’s significance.
Conclusion
A shooting star candlestick is a significant indicator showing a potential shift from bullish to bearish trends when it appears at the peak of an uptrend. When traders use this pattern, it’s crucial to manage risks effectively. This ensures there’s a safety measure in place if the market doesn’t follow the expected path. Before acting on the shooting star pattern, traders should verify the signal by examining other technical indicators.
Also, check our Article on TWEEZER TOP & BOTTOM CANDLESTICK PATTERN.
Learn about Rainbow Moving Averages Strategy for Identifying Seasonal Trends by Clicking Here.
If you’d like to know how we analyze the market and provide accurate levels every day. then click on the Free Demo button below and change your trading life for good. 5X returns are possible in options trading If you have Spider Software in your trading system.


