
In Today’s Stock Market, Sensex surged by 1,000 points while the Nifty reached a new all-time high, driven by five factors contributing to the market rally.
Stock Market Nifty Chart Prediction.
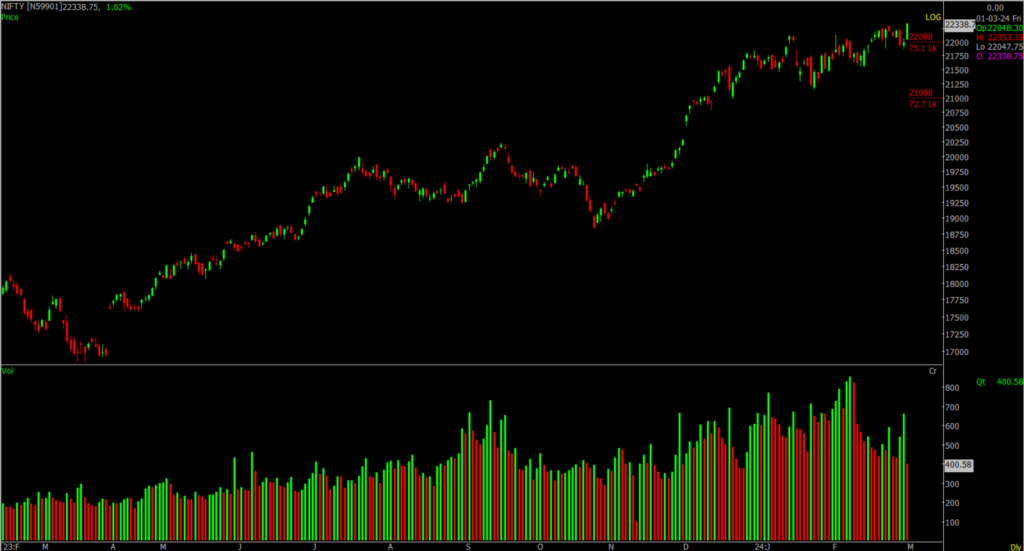
Indian benchmark indices closed higher for the second day in a row, reaching new record highs on March 1st, with the Nifty index surpassing the 22,300 mark.
Profit booking is evident in the early special trading session, but the market appears to maintain a bullish sentiment.
At the market’s close, the Sensex surged by 1,245.05 points or 1.72%, reaching 73,745.35, while the Nifty climbed by 356.00 points or 1.62%, closing at 22,338.80. Among the listed stocks, 2,079 witnessed gains, 1,214 experienced declines, and 77 remained unchanged.
Top gainers on the Nifty included Tata Steel, L&T, JSW Steel, Titan Company and IndusInd Bank, while losers were Dr Reddy’s Laboratories, Sun Pharma, HCL Technologies, Infosys and Britannia Industries.
Metal index rose by 4%, while auto, bank, capital goods, and oil & gas sectors each gained 2%. Conversely, healthcare index fell by 1%, and Information Technology index declined by 0.5%.Top of Form
Additionally, both BSE midcap and smallcap indices added 0.5 percent each.
Stock Prediction for 02st March 2024.
| STOCK | Good Above | Weak Below |
| HINDCOPPER | 272 | 268 |
| NESTLEIND | 2625 | 2580 |
| PIDILITIND | 2770 | 2730 |
| SRF | 2420 | 2378 |
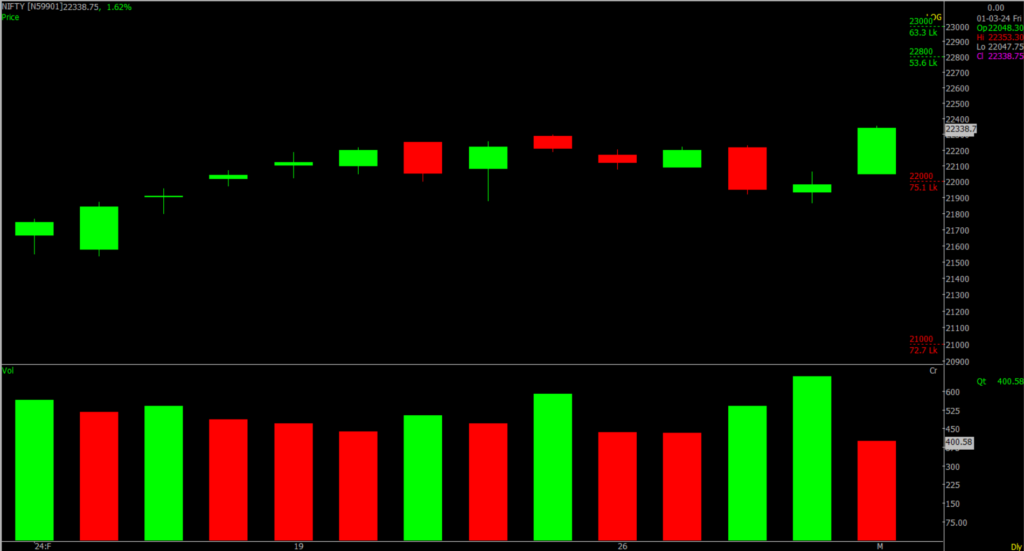
Prediction For Saturday, NIFTY can go up if it goes above 22,800 or down after the level of 22,000 but all depends upon the Global cues.
The Nifty opened higher and continued to climb throughout the day, closing with a gain of approximately 356 points. Analyzing the daily charts, it appears that the Nifty has broken out of a Running Triangle pattern, suggesting the start of a new upward movement. From a short-term perspective, we anticipate the Nifty to target levels between 22,800 and 23,000. However, it’s crucial to note that the range of 22,000 to 21,800 now serves as a significant support zone, and a breach below this range could signal a trend reversal.
| Highest Call Writing at | 22,800 (53.6 Lakhs) |
| Highest Put Writing at | 22,000 (75.1 Lakhs) |
Nifty Support and Resistance
| Support | 22,000, 21,800 |
| Resistance | 22,800, 23,000 |
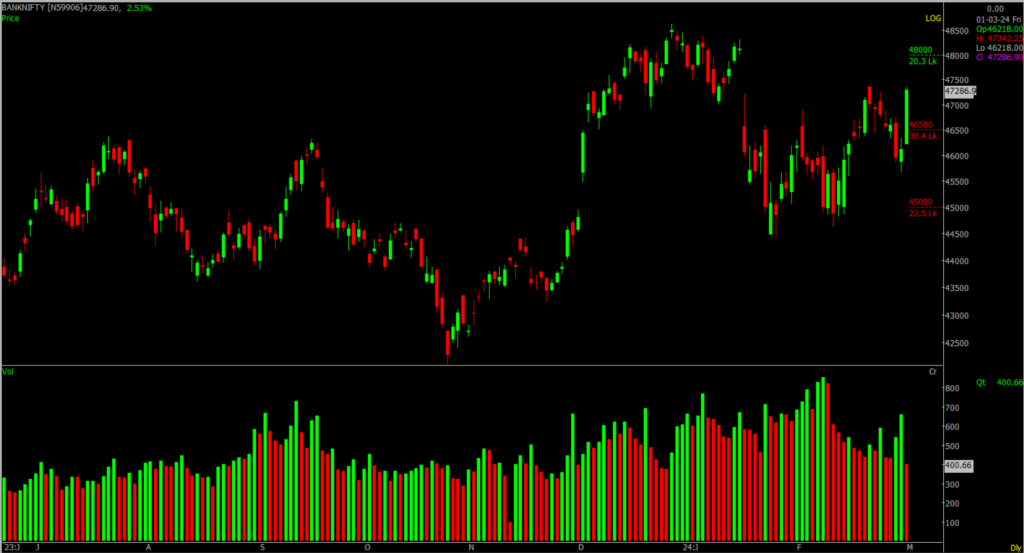
Bank Nifty Daily Chart Prediction.
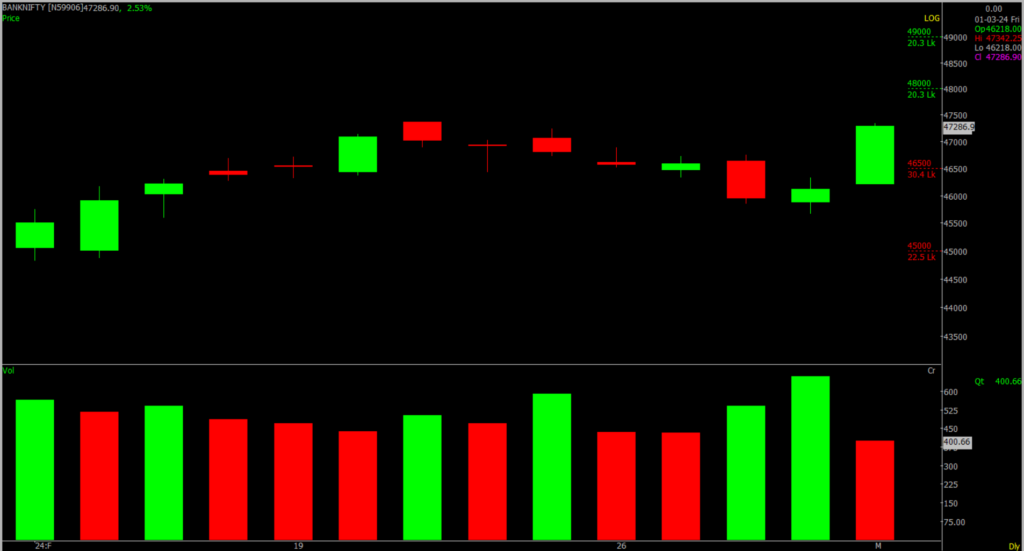
Prediction For Saturday, Bank NIFTY can go up if it goes above 48,000 or down after the level of 46,500 but it all depends upon the Global cues.
Bullish momentum continued to drive the Bank Nifty as it surged past key resistance levels with considerable trading volumes. Presently, the index finds support within the range of 46,500 to 45,800, and any retracement towards this support zone is viewed as a favourable chance to buy. Signals are strong that the index is on track to surpass its previous record high around the 48,500 level in the foreseeable future.
| Highest Call Writing at | 48,000 (20.3 Lakhs) |
| Highest Put Writing at | 46,500 (30.4 Lakhs) |
Bank Nifty Support and Resistance
| Support | 46,500, 45,800 |
| Resistance | 48,000, 49,000 |
Also, learn what a Shooting Star Candlestick Pattern indicates.
Join our Upcoming Webinar on Identifying reversal points with the help of OI/PCR Data. Click Here To Join.
If you’d like to know how we analyze the market and provide accurate levels every day. then click on the Free Demo button below and change your trading life for good. 5X returns are possible in options trading If you have Spider Software in your trading system.
Disclaimer: The information provided in this Blog is for educational purposes only and should not be construed as financial advice. Trading in the stock market involves a significant level of risk and can result in both profits and losses. Spider Software & Team does not guarantee any specific outcome or profit from the use of the information provided in this Blog. It is the sole responsibility of the viewer to evaluate their own financial situation and to make their own decisions regarding any investments or trading strategies based on their individual financial goals, risk tolerance, and investment objectives. Spider Software & Team shall not be liable for any loss or damage, including without limitation any indirect, special, incidental or consequential loss or damage, arising from or in connection with the use of this blog or any information contained herein. ![]()