
In Stock Market Today, Fresh peak for Nifty as it surpasses 21,590; Sensex records a 500-point rise; Top gainers PSU Banks and metals.
Stock Market Nifty Chart Prediction.
For the fourth consecutive day, benchmark indices closed higher on December 27, with Nifty surpassing the 21,600 mark.
At the closing bell, the Sensex marked a gain of 701.63 points or 0.98 percent, reaching 72,038.43, while the Nifty rose by 213.50 points or 1.00 percent to stand at 21,654.80. The market witnessed 1801 advancing shares, 1848 declining shares, and 124 unchanged.
Noteworthy gainers on the Nifty included Hindalco Industries, UltraTech Cement, Bajaj Auto, JSW Steel, and Tata Motors. Conversely, the losers were ONGC, NTPC, Adani Enterprises, UPL, and Adani Ports.
With the exception of oil & gas and power sectors, all other sectoral indices closed in positive territory, with auto, bank, and metal sectors showing a 1 percent increase.
The BSE midcap and smallcap indices posted marginal gains.
Stock Prediction for 28th Dec 2023
1) AUBANK: Good Above 777, Weak Below 770
2) EXIDEIND: Good Above 302, Weak Below 298
3) HCLTECH: Good Above 1482, Weak Below 1463
4) TVSMOTOR: Good Above 2025, Weak Below 2002
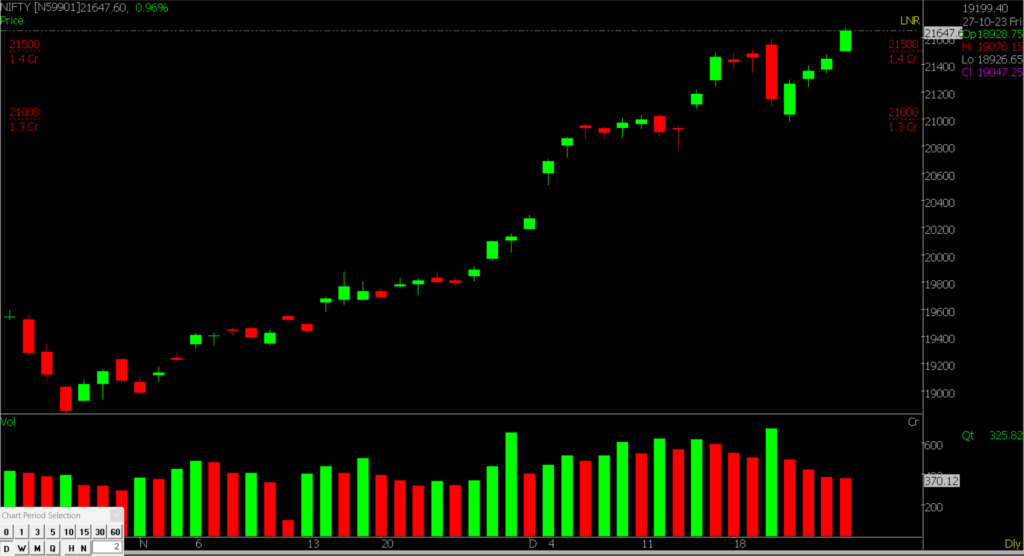
Prediction For Thursday NIFTY can go up if it goes above 21800 or down after the level of 21500 but all depends upon the Global cues.
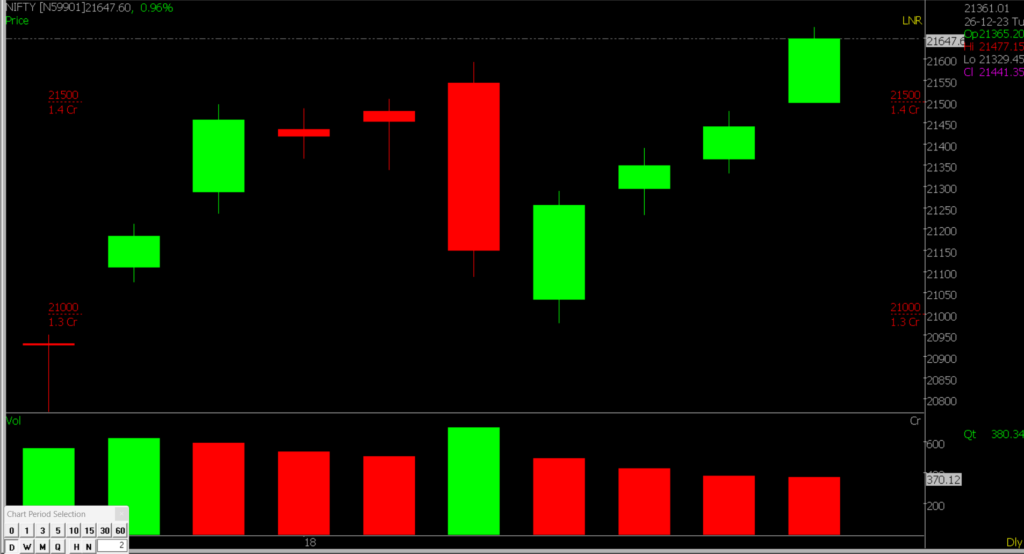
Nifty saw a strong surge as considerable positions were established by Put writers at the 21500 level. Moreover, the daily chart displayed a breakout from a consolidation phase. There is speculation that Nifty will have a Bullish Trend. Looking forward, the index is likely aiming for a range between 21750-21800 on the upside, with support resting at 21500.
| Highest Call Writing at | 21800 (88.4 Lakhs) |
| Highest Put Writing at | 21500 (1.4 Crores) |
Nifty Support and Resistance
| Support | 21500, 21300 |
| Resistance | 21750, 21800 |
Bank Nifty Daily Chart Prediction
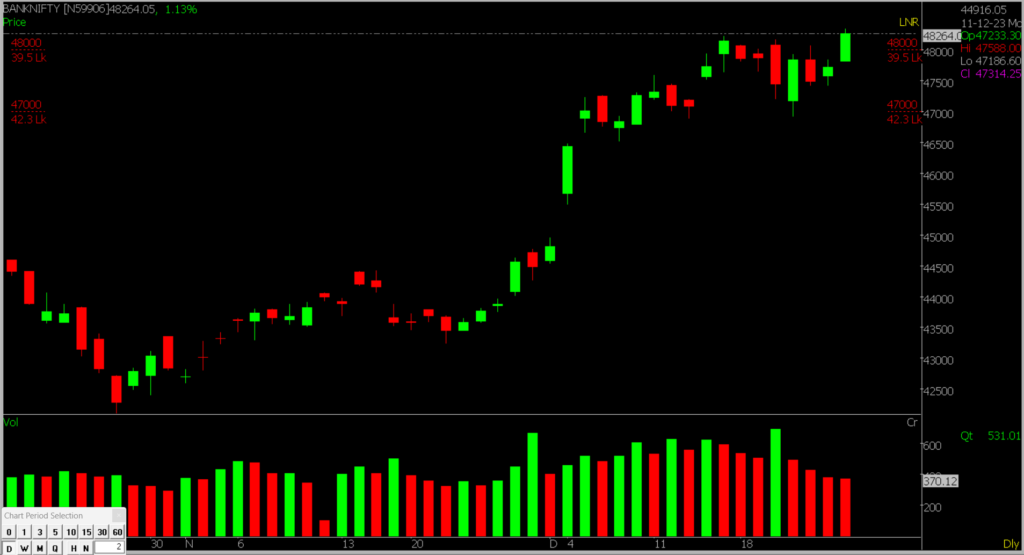
Prediction For Thursday Bank NIFTY can go up if it goes above 48500 or down after the level of 48000 but it all depends upon the Global cues.
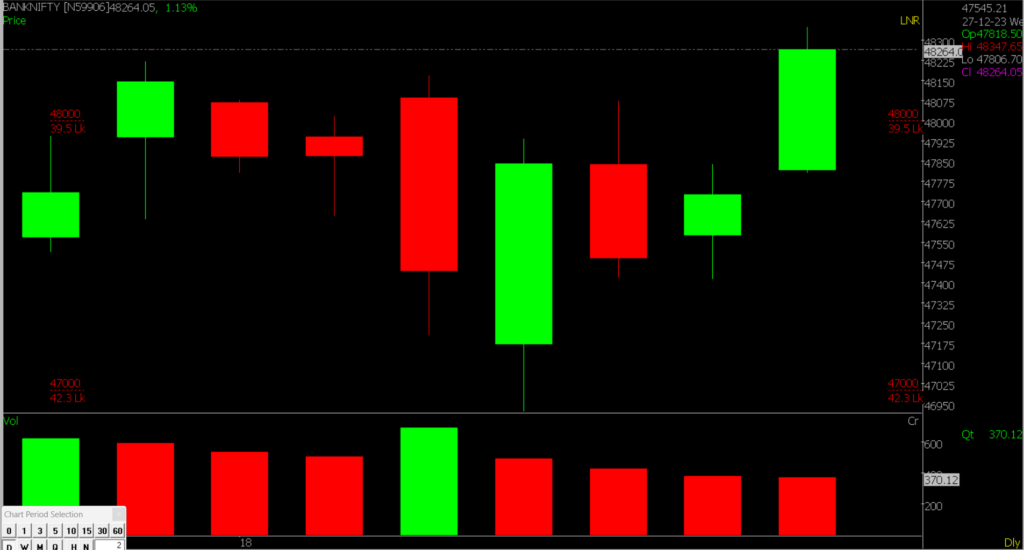
Bank Nifty recently broke out from consolidation, evident on the daily chart. It has been consistently holding above a crucial moving average. Moreover, exactly like Nifty, Bank Nifty is also showing a Bullish Trend . Looking ahead, the index might target levels between 48500-48800 on the upside, with support at 48000.
| Highest Call Writing at | 48500 |
| Highest Put Writing at | 48000 (39.5 Lakhs) |
Bank Nifty Support and Resistance
| Support | 48500, 48800 |
| Resistance | 48000, 47850 |
Also, check our Article on how Rounding Top Pattern is formed on various stocks.
If you’d like to know how we analyze the market and provide accurate levels every day. then click on the Free Demo button below and change your trading life for good. 5X returns are possible in options trading If you have Spider Software in your trading system.
Disclaimer: The information provided in this Blog is for educational purposes only and should not be construed as financial advice. Trading in the stock market involves a significant level of risk and can result in both profits and losses. Spider Software & Team does not guarantee any specific outcome or profit from the use of the information provided in this Blog. It is the sole responsibility of the viewer to evaluate their own financial situation and to make their own decisions regarding any investments or trading strategies based on their individual financial goals, risk tolerance, and investment objectives. Spider Software & Team shall not be liable for any loss or damage, including without limitation any indirect, special, incidental or consequential loss or damage, arising from or in connection with the use of this blog or any information contained herein.