
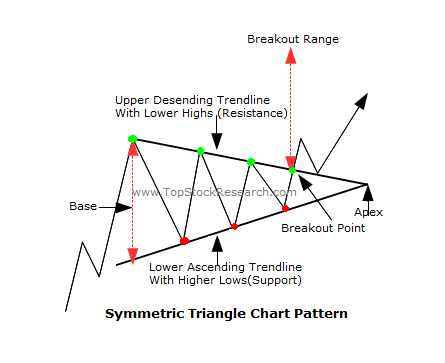
A symmetrical triangle pattern is a chart pattern formed when an asset’s price moves within two converging trendlines, creating a triangle shape that narrows over time.
What is Symmetrical Triangle Pattern?
Traders and analysts use this pattern to predict the future direction of the price. It is a continuation pattern, suggesting that the existing trend is likely to continue. Traders typically wait for a breakout above or below the trendlines before taking a position, with increased volatility and volume accompanying the breakout. Symmetrical triangle pattern should be used in conjunction with fundamental analysis and market trends for investment decisions.
How to use Symmetrical Triangle Pattern?
To use the symmetrical triangle pattern in technical analysis, follow these steps:
- Identify the pattern: Look for converging trendlines formed by higher lows and lower highs on the price chart.
- Confirm the pattern: Ensure that each trendline has at least two touchpoints, indicating the strength of the pattern.re.
- Determine the direction: Assess the trend direction before the pattern’s formation (bullish if an uptrend, bearish if a downtrend).
- Wait for the breakout: Monitor the price as it approaches the apex of the triangle and wait for a breakout above or below either trendline.
- Confirm the breakout: Validate the breakout by observing sustained price movement in the breakout direction.
- Set stop-loss and target levels: Mitigate risk by placing a stop-loss order below the breakout level (for long positions) or above it (for short positions). Establish a target level by measuring the triangle’s height and projecting it in the breakout direction.
- Consider additional factors: Enhance your analysis by incorporating other
- technical indicators, such as moving averages or volume analysis.
Always remember that technical analysis is not foolproof, and false breakouts or market volatility can occur. It’s crucial to practice proper risk management and consider other factors like fundamental analysis and market sentiment when making trading decisions.
Placing Stops and Taking Profits in Symmetrical Triangle Pattern
When using the symmetrical triangle pattern in technical analysis, it’s crucial to have a plan for placing stops and taking profits. Here’s a suggested approach:
- For a bullish breakout (price breaking above the upper trendline), consider placing a stop-loss order below the breakout level or below the lowest point of the triangle pattern.
- For a bearish breakout (price breaking below the lower trendline), place a stop-loss order above the breakout level or above the highest point of the triangle pattern.
Take-profit order:
- Measure the height of the triangle pattern from the widest part (the base) to the apex where the trendlines converge.
- Project the measured height in the direction of the breakout. For a bullish breakout, add the measured height to the breakout level. For a bearish breakout, subtract the measured height from the breakout level.
- This projected distance can serve as a potential profit target.
Symmetrical Triangle Pattern on ZEELEARN in Daily charts
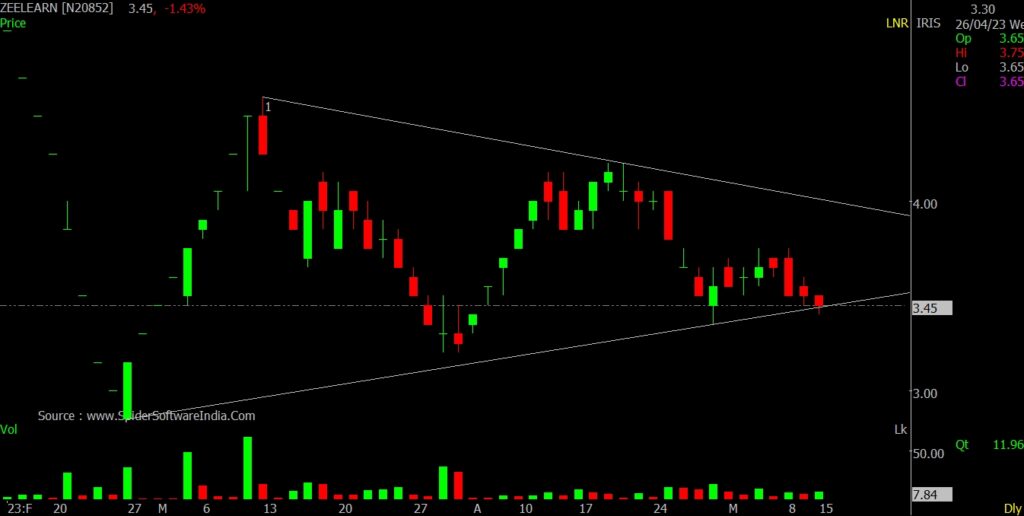
ZEELEARN is exhibiting a potential Symmetrical Triangle Pattern in its daily chart. However, traders should always confirm the pattern before entering a trade and implement proper risk management measures to mitigate potential losses.
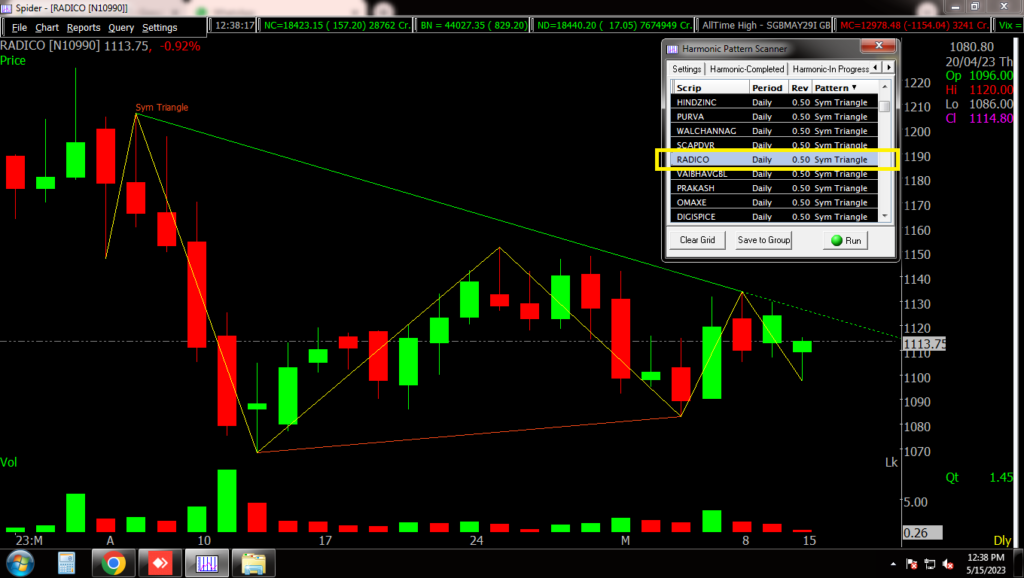
How to find the Stocks with Symmetrical Triangle Pattern Formation?
It is super easy to find any chart pattern using Spider Software, Symmetrical Triangle Pattern can be found using the Chart Pattern Scanner of Spider, in just a couple of clicks..
Check out our Blog on Understanding Hedging Strategy to Manage Stock Market Risks
Don’t miss out on our Upcoming Master-Class on Learn & Trade Live on Expiry Day.
Register now and take your Trading game to the next level. *Click Here To Register*
Disclaimer: The information provided in this Blog is for educational purposes only and should not be construed as financial advice. Trading in the stock market involves a significant level of risk and can result in both profits and losses. Spider Software & Team does not guarantee any specific outcome or profit from the use of the information provided in this Blog. It is the sole responsibility of the viewer to evaluate their own financial situation and to make their own decisions regarding any investments or trading strategies based on their individual financial goals, risk tolerance, and investment objectives. Spider Software & Team shall not be liable for any loss or damage, including without limitation any indirect, special, incidental or consequential loss or damage, arising from or in connection with the use of this blog or any information contained herein. ![]()


