VIX is a market index that provides expectations based on the trading market.
Role of Volatile Index in Stock Market
It measures the amount of volatility that traders expect over the next thirty days in the NSE index. Simply, it is a calculation of price swings investors expect in the market over important market news. When the value of the index is low. it indicates the absence of fear factor in the market, meaning investors are more confident to invest.
Conversely, a higher value is an indication of rising uncertainties and fear factors. Although India Volatility Index was introduced in the market in 2008, the volatility index originally appeared in the Chicago exchange in 1993. It helped gauge the presence of fear factors in the market.
Volatility Index:
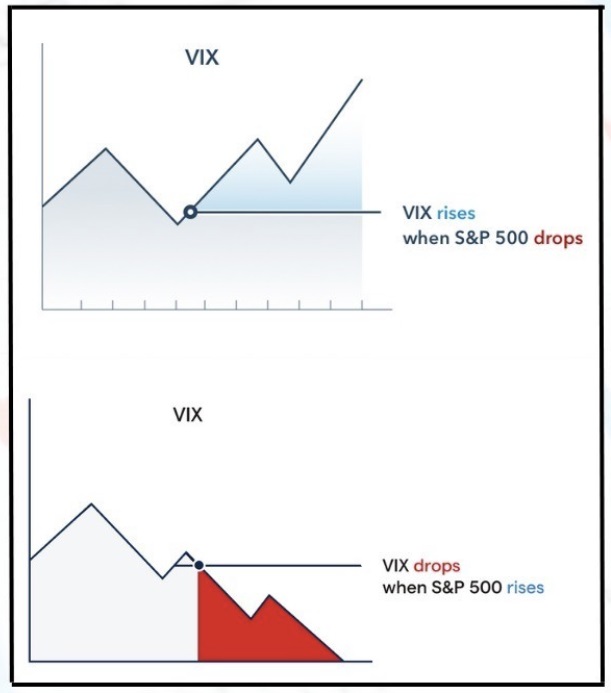
Volatile Index move in the opposite direction. A higher VIX indicates higher volatility in the market, vice-versa a lower VIX, which means low volatility in NIFTY.
How the Volatility Index Is Used
The VIX can help investors gauge market sentiment as well as volatility to identify investment opportunities. As volatility can often signal negative stock market performance, volatility investments can be used to speculate and hedge risk.
This knowledge can be used to make informed investment decisions. Typically, when the price of the Index is:
0-15: This can indicate a certain amount of optimism in the market as well as very low volatility.
15-25: This can indicate that there is a certain amount of volatility, but nothing extreme.
25-30: This can indicate that there is a certain amount of market turbulence and volatility is increasing.
30 & Over: This can indicate that the market is highly volatile and there may be some extreme swings soon.
And because Volatily is an index, it can be tracked and traded using various options and exchange-traded products. Investors also have the option to use Volatility Index values to price derivatives.
You cannot purchase it like a stock or bond. Instead, you must purchase instruments that respond to fluctuations of the volatile index. Traders can place their hedges through volatility options and futures. There are also nearly two-dozen volatility exchange-traded products (ETPs) for the VIX. This includes exchange-traded funds (ETFs) holding assets and exchange-traded notes (ETNs).
How traders and investors can use the India Volatility Index data?
Long term investors can tweak their sector exposure and hedges based on shifts in VIX. For example, if VIX is moving up sharply, then investors can shift to defensive sectors or increase their hedge ratio.
VIX adds a lot of value for traders. It is possible to trade VIX futures on the NSE. For example, if you expect volatility in the market to go up, then the VIX would go up. In such a case you can buy VIX futures. Here the trader is only taking a view on volatility; not the market direction. These types of trades are very useful in times of key events or key announcements and policies.
If you look at the long term chart of the VIX, it has been normally ranging between 13 and 17. It has gone as low as 9.5 and as high as 60, but these are exceptions. You can use the median range chart of VIX to trade on mean reversion.
Lastly, VIX gives you the short term range to trade. The Nifty spot range is defined by the VIX and one can go long or short at the appropriate levels.
VIX is a smart way to interpret the markets and trade on volatility. It provides a non-directional approach to markets.
Click here to check out our New Blog on How to Identify Elliot Wave Theory
Disclaimer: The information provided in this Blog is for educational purposes only and should not be construed as financial advice. Trading in the stock market involves a significant level of risk and can result in both profits and losses. Spider Software & Team does not guarantee any specific outcome or profit from the use of the information provided in this Blog. It is the sole responsibility of the viewer to evaluate their own financial situation and to make their own decisions regarding any investments or trading strategies based on their individual financial goals, risk tolerance, and investment objectives. Spider Software & Team shall not be liable for any loss or damage, including without limitation any indirect, special, incidental or consequential loss or damage, arising from or in connection with the use of this blog or any information contained herein.