
Simple Moving Average (SMA) is a widely used technical analysis tool that helps traders identify trends and potential entry or exit points in the market
What is Simple Moving Average?
In trading, a Simple Moving Average (SMA) is a widely used technical analysis tool that helps traders identify trends and potential entry or exit points in the market. It calculates the average price of an asset over a specified period, smoothing out short-term price fluctuations and providing a clear picture of the asset’s direction.
Working of Simple Moving Average:
Determine the closing price: Gather the closing price data for the asset you want to analyze. This can be done over a specific time frame, such as daily or weekly.
Choose a time period: Select the number of periods to include in the SMA calculation. For example, a 50-day SMA would use the closing prices for the past 50 days.
Calculate the average: Add up the closing prices for the specified time period and divide by the number of periods to get the average.
Plot the SMA: Plot the resulting values as a line on a price chart.
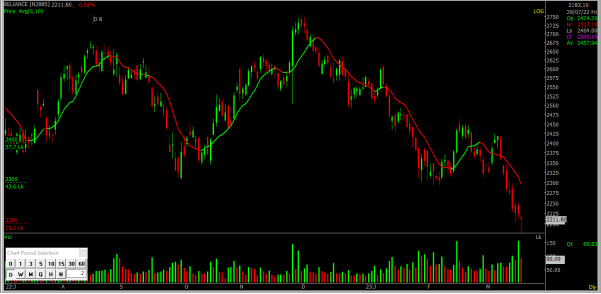
Simple Moving Average on Reliance daily chart
How to use Simple Moving Average in Spider Software?
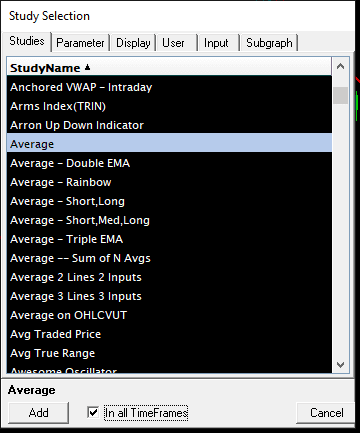
Press S -> Select Parametres -> Apple -> OK
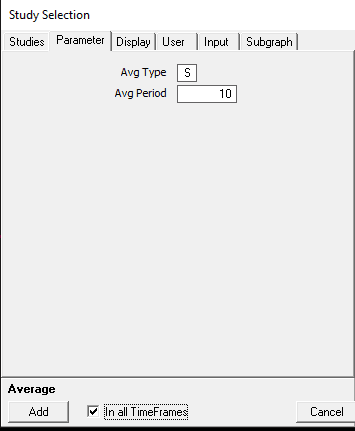
Parameters for Simple Moving Average (S,20)
Conclusion:
By plotting the SMA on a price chart, traders can analyze the slope and direction of the line to determine whether the asset is in an uptrend, downtrend, or range-bound. This information can be used to generate trading signals and make informed decisions about when to enter or exit a trade.
*Learn More In Depth About The Swift Entry & Exist Options Strategy*
SMA is a simple yet effective tool for analyzing market trends and identifying potential opportunities, making it a valuable tool for traders of all levels of experience.
Disclaimer:
The information provided in this Blog is for educational purposes only and should not be construed as financial advice. Trading in the stock market involves a significant level of risk and can result in both profits and losses. Spider Software & Team does not guarantee any specific outcome or profit from the use of the information provided in this Blog. It is the sole responsibility of the viewer to evaluate their own financial situation and to make their own decisions regarding any investments or trading strategies based on their individual financial goals, risk tolerance, and investment objectives. Spider Software & Team shall not be liable for any loss or damage, including without limitation any indirect, special, incidental or consequential loss or damage, arising from or in connection with the use of this blog or any information contained herein.
Disclaimer: The information provided in this Blog is for educational purposes only and should not be construed as financial advice. Trading in the stock market involves a significant level of risk and can result in both profits and losses. Spider Software & Team does not guarantee any specific outcome or profit from the use of the information provided in this Blog. It is the sole responsibility of the viewer to evaluate their own financial situation and to make their own decisions regarding any investments or trading strategies based on their individual financial goals, risk tolerance, and investment objectives. Spider Software & Team shall not be liable for any loss or damage, including without limitation any indirect, special, incidental or consequential loss or damage, arising from or in connection with the use of this blog or any information contained herein. ![]()