Knowing bearish candlestick patterns helps traders read market trends and make better trading decisions for profitable outcomes.
What are Bearish Candlestick Patterns?
Bearish candlestick patterns are formations on price charts indicating potential downward market movements. They provide visual cues about market sentiment and potential price direction, suggesting that the asset’s price is likely to decline. Traders use these patterns to identify selling opportunities and make informed decisions on when to enter or exit trades. Spotting a bearish pattern allows traders to adjust strategies, like selling short or setting stop-loss orders to protect their positions.
Also to note that, Bearish reversal candlestick patterns can be single or multiple candlestick formations. It’s essential to note that these patterns should form at the end of an uptrend; otherwise, they may act as continuation patterns. To confirm the validity of bearish reversal signals, traders should use other indicators like volume and resistance levels.
Below we will be discussing the 5 most important Bearish Candlestick Patterns that every trader should know.
Types of Bearish Candlestick Patterns
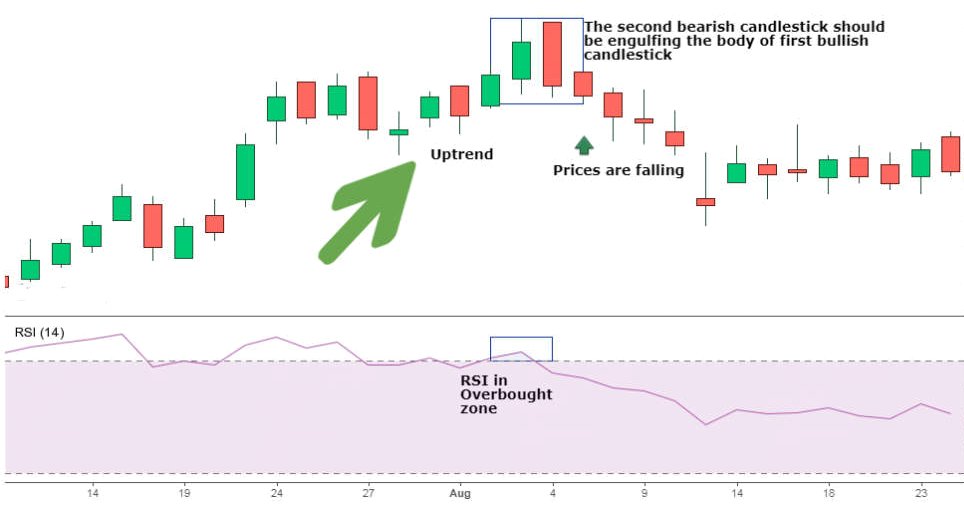
Bearish Engulfing Pattern:
The bearish engulfing pattern is a bearish reversal pattern that signals a reversal of the uptrend and indicates a fall in prices due to selling pressure exerted by sellers when it appears at the top of an uptrend.
This pattern triggers a reversal of the ongoing uptrend as sellers enter the market and cause prices to fall.
The pattern consists of two candles, with the second bearish candle engulfing the ‘body’ of the previous green candle.
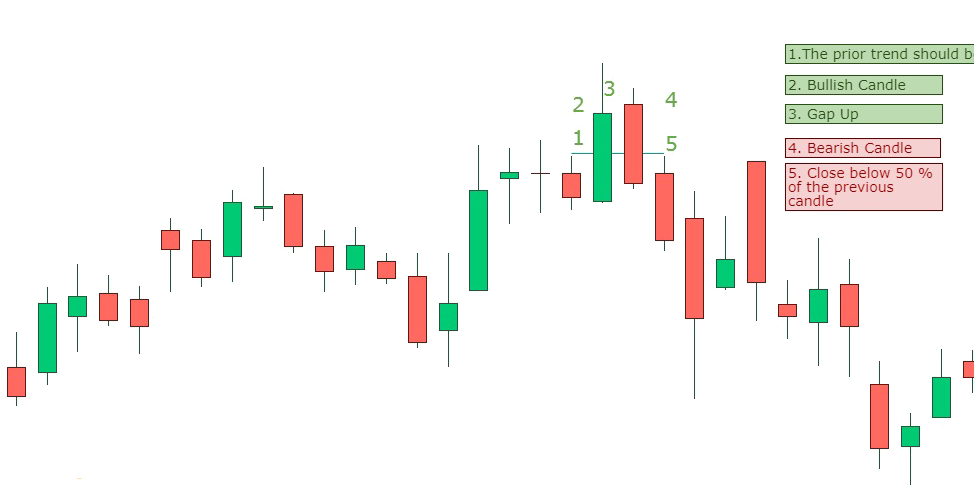
Evening Star Pattern:
Traders use an Evening Star candlestick pattern to analyze when an uptrend is likely to reverse to a downtrend.
The pattern comprises three candlesticks: a large bullish candlestick, a small-bodied candle, and a bearish candlestick.
Evening Star patterns appear at the top of the uptrend and signal the potential reversal of the uptrend to a downtrend.

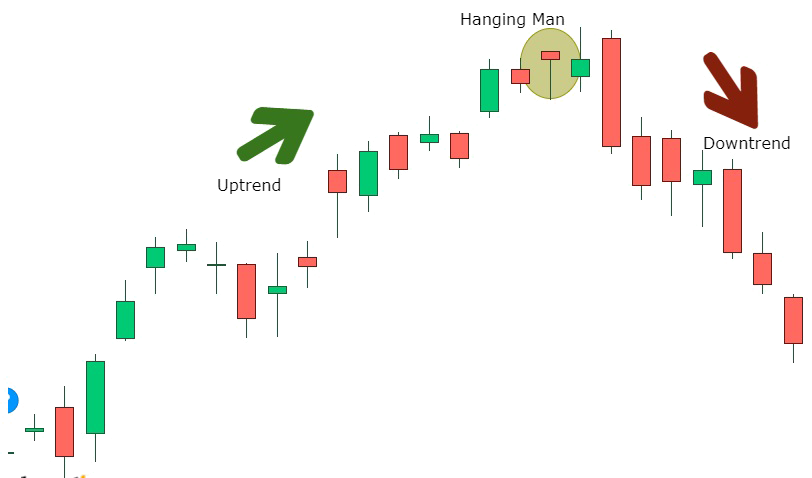
The Hanging Man Pattern:
The Hanging Man is a bearish reversal candlestick pattern characterized by a long lower shadow and a small real body.
This pattern appears at the end of an uptrend, indicating weakness in the ongoing price movement and suggesting that the bulls have pushed the prices up, but they are unable to push further.
The Hanging Man has a small real body, signifying a small distance between the opening and closing price. The lower shadow should be twice the length of its body, and there is no upper shadow.
Traders use this pattern to square their buy position and enter a short position.
Dark Cloud Cover:
The Dark Cloud Cover is a bearish reversal candlestick pattern that traders use to identify weaknesses in the uptrend and potential price reversals.
This pattern consists of two candlesticks: the first one is a bullish candlestick, and the second one is a bearish candlestick.
As prices rise, this pattern gains importance in signaling a potential reversal to the downside.
Three Black Crows:
The Three Black Crows pattern is a multiple candlestick pattern used to anticipate a reversal from an uptrend to a downtrend.
This pattern emerges when sellers exert bearish forces, leading to prices falling for three consecutive days.
Traders can initiate a short position once the bearish candlestick pattern is formed.
For confirmation of this candlestick pattern’s formation, traders should rely on volume and technical indicators.

To Sum Up
Bearish candlestick patterns are formations that suggest a potential downward movement in the market. Traders use them to identify selling opportunities and predict reversals from uptrends to downtrends. Some types discussed include Bearish Engulfing, Evening Star, Hanging Man, Dark Cloud Cover, and Three Crows. Confirming with volume and indicators increases pattern reliability. These patterns help traders make informed decisions and adjust their strategies accordingly.
Learn how to Trade like a PRO on the Expiry Day. Click Here To Register

Also, if want to how Commodity & Currency Trading can be beneficial? Click here to Know
Disclaimer: The information provided in this Blog is for educational purposes only and should not be construed as financial advice. Trading in the stock market involves a significant level of risk and can result in both profits and losses. Spider Software & Team does not guarantee any specific outcome or profit from the use of the information provided in this Blog. It is the sole responsibility of the viewer to evaluate their own financial situation and to make their own decisions regarding any investments or trading strategies based on their individual financial goals, risk tolerance, and investment objectives. Spider Software & Team shall not be liable for any loss or damage, including without limitation any indirect, special, incidental or consequential loss or damage, arising from or in connection with the use of this blog or any information contained herein. ![]()